
Figure 3.
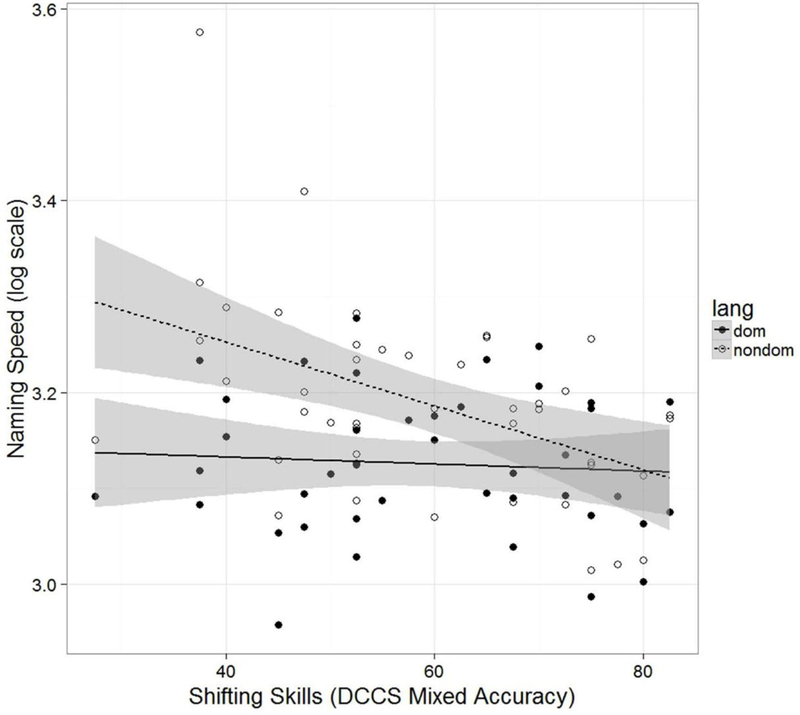
Naming speed (ms log10 scale), as a function of task-shifting ability, separately for each language. This figure presents the bivariate correlation from the raw data; it is not derived from the mixed-effects model. Each point represents a participant. Gray shading indicates 95% confidence interval.