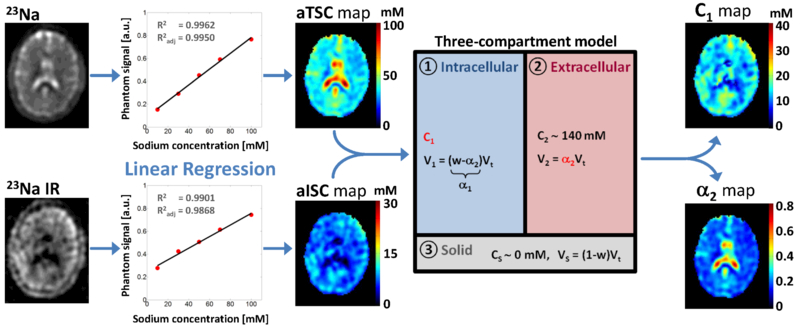
Fig. 1.
Diagram of the brain 23Na MRI data processing steps: (1) acquisition with and without fluid suppression by IR; (2) linear regression from the 23Na signal of calibration phantoms; calculation of aTSC and aISC maps from the linear regression; (3) calculation of C1 and α2 maps based on the three-compartment model, with C1 = C2S2 / (C2w – S2 + S1) and α2 = (S1 – S2)/C2. In this model C2 = 140 mM (extracellular compartment sodium concentration), w = 0.775 (water volume fraction), S1 = aTSC and S2 = aISC. Abbreviations: α2 = pseudo-extracellular volume fraction; aISC = apparent intracellular sodium concentration; aTSC = apparent total sodium concentration; C1 = pseudo-intracellular sodium concentration

