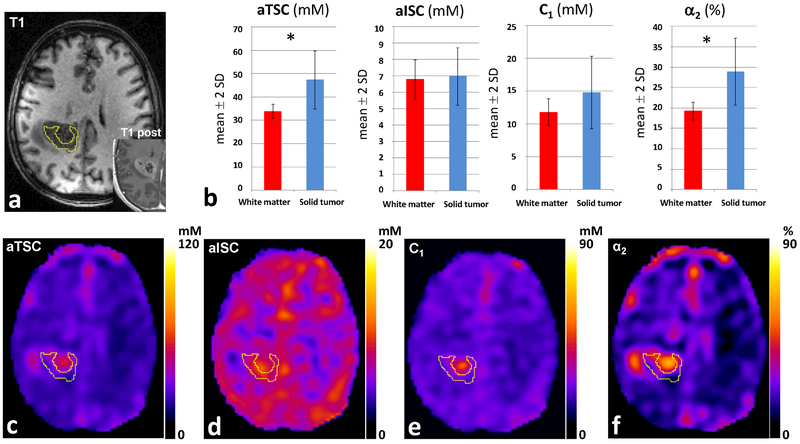
Fig. 4.
Glioblastoma, WHO grade IV, IDH-wildtype. (A) Tumor demonstrating heterogeneous contrast enhancement on T1 post-contrast image on 1H-MRI. (B) 23Na-MRI demonstrates in the solid tumor increased values of aTSC and α2 compared to NAWM, while values of aISC and C1 are similar to NAWM. (C) aTSC map. (D) aISC map. (E) C1 map. (F) α2 map. * = statistically significant difference (p<0.05). Abbreviations: α2 = pseudo-extracellular volume fraction; aISC = apparent intracellular sodium concentration; aTSC = apparent total sodium concentration; C1 = pseudo-intracellular sodium concentration. NAWM = normal appearing white matter

