
Figure 3. Rbfox Knockout in Skeletal Muscle Causes Widespread Transcriptome Changes.
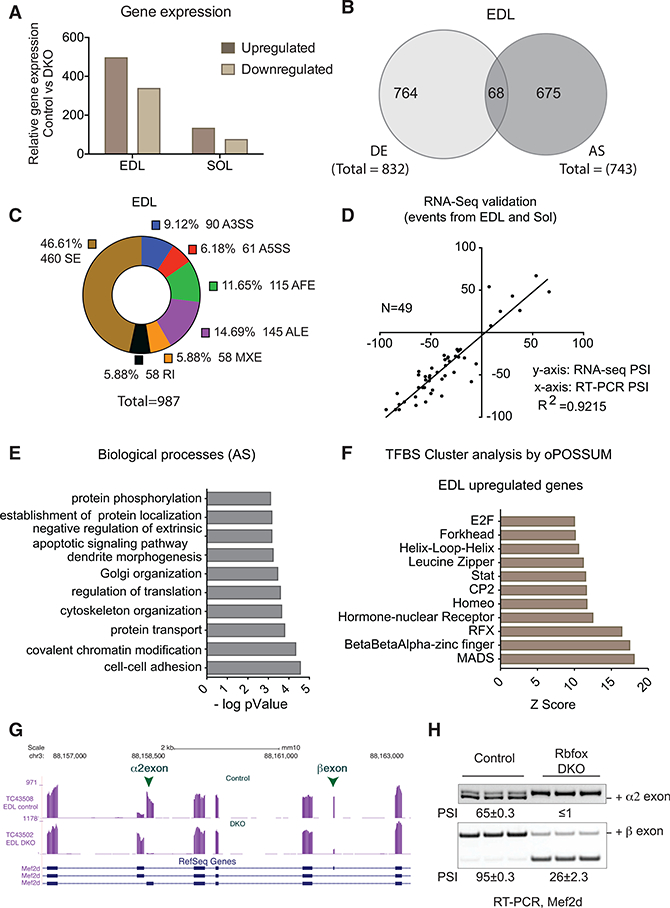
(A) Bar graphs showing gene expression changes (FDR < 0.05) in EDL and soleus muscles 2 weeks after the induction of Rbfox DKO compared to control muscles.
(B) Venn diagram showing differentially expressed (DE) and alternatively spliced (AS) gene transcripts in DKO compared to control EDL muscle (FDR < 0.05 for DE and PSI ≥ 0.2 for AS).
(C) Donut chart showing a description of tran- scriptome changes in EDL muscle 2 weeks after Rbfox knockout compared to control muscle. SE, cassette exons; A3SS, alternative 3ʼ splice site; A5SS, alternative 5ʼ splice site; AFE, alternative first exon; ALE, alternative last exon; MXE, mutually exclusive exons; RI, retained intron.
(D) 49 randomly selected alternative splicing events in EDL and soleus muscles were validated by RT-PCR, and ∆PSI was plotted against ∆PSI derived from RNA-seq data.
(E) DAVID gene ontology (GO) analyses showing biological processes enriched in genes that are alternatively spliced in Rbfox-knockout muscles.
(F) oPOSSUM analysis to determine the enrichment ofclustered transcription factor-binding sites (TFBSs) in genes that are upregulated after Rbfox knockout.
(G) RNA-seq tracks for Mef2d in control and Rbfox-DKO muscles showing that muscle-specific inclusion of α2 and β exons requires Rbfox proteins.
(H) RT-PCR showing reduced PSI for Mef2d α2 and β exons in DKO muscle when compared to control muscle (n = 3).