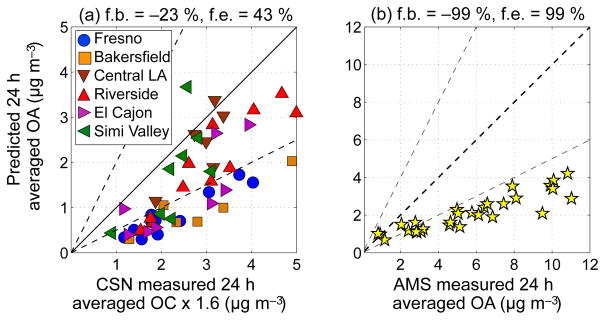
Figure 3.
Scatter plot of VBS-IVOC OA predictions versus 24 h measurements from (a) filters collected at sites in the Chemical Speciation Network (CSN) and (b) HR-AMS measurements at the Pasadena ground site during the CalNex campaign. In panel (a) the model–measurement comparison is for six sites in California (Fresno, Bakersfield, Central Los Angeles, Riverside, El Cajon, and Simi Valley). f.b. is the fractional bias and f.e. is the fractional error ; P is the predicted value, M is the measured value and N is the sample size.

