
Figure 5.
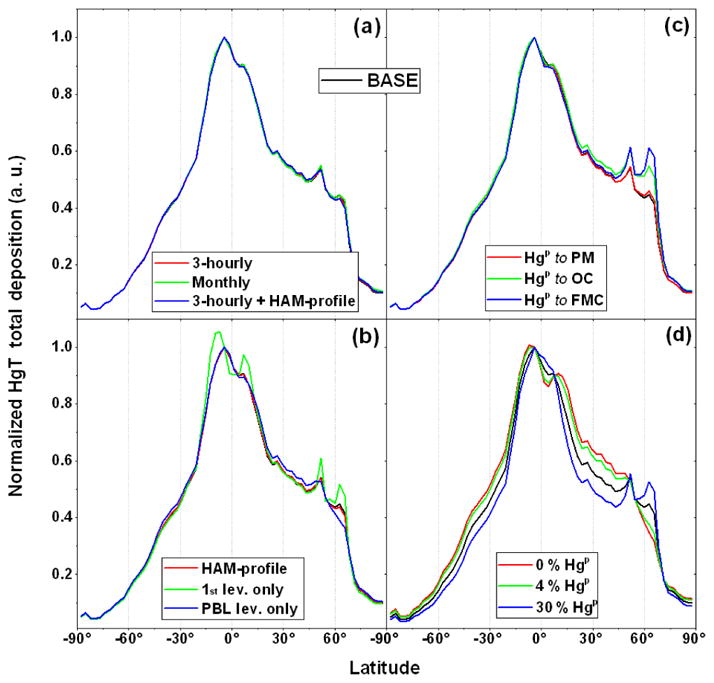
Latitudinal profiles of the normalised Hg total deposition from the model BASE run, compared with a selection of sensitivity runs, assuming (a–b) different emission time resolution and vertical profile, as well as a combination of both; (c) different HgP emission geographical distributions, as well as different ratios. The normalisation was done by maximum.