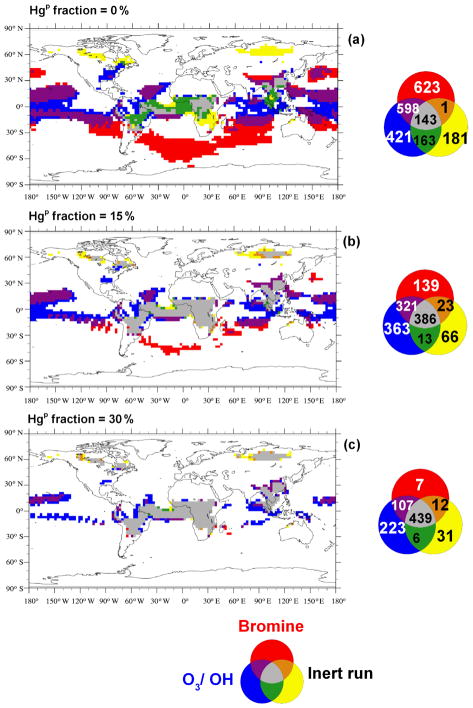
Figure 8.
Agreement maps, under three different speciation scenarios, 0 % (a), 15 % (b) and 30 % (c) HgP, of high Hg deposition model cells obtained considering only BB and using the O3 / OH, the Br oxidation mechanisms, and a sensitivity run where all Hg BB emissions were considered inert (i.e. all HgP). The deposition field from for this “inert” run was retained under the three different speciation scenarios. The maps show the areas where deposition is greater than μ + σ.

