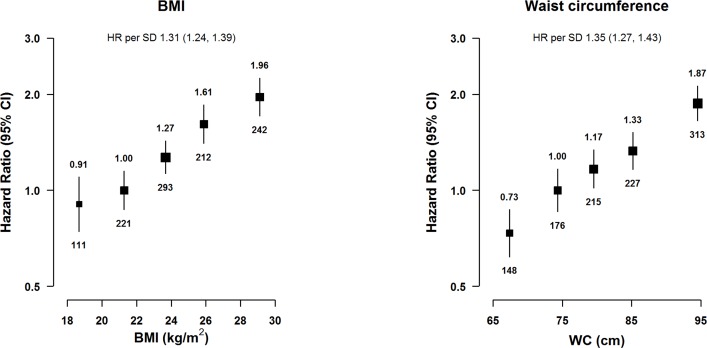
Fig 1. Adjusted HRs for acute pancreatitis by BMI and WC.
BMI was classified as <20.0, 20.0 to <22.5 (reference), 22.5 to <25.0, 25.0 to <27.0, and ≥27.0 kg/m2. WC was classified by quintiles (<71.7, 71.7 to <77.0 [reference], 77.0 to <82.2, 82.2 to <88.5, and ≥88.5 cm). Model was stratified by sex and region and adjusted for age at baseline, education, smoking, alcohol, and medication (aspirin, ACE-I, beta blockers, statins, diuretics, Ca++ antagonists, metformin, and insulin). Time since birth was used as the underlying time scale with delayed entry at age at baseline. HRs were plotted against the mean level in each adiposity group. Log-scale was used for the y-axis. The squares represent HRs, and the vertical lines represent 95% CIs. The area of the squares is inversely proportional to the variance of the log HRs. The numbers above the vertical lines are point estimates for HRs, and the numbers below the lines are numbers of events. BMI was missing in 2 participants. SD was 3.4 kg/m2 for BMI and 9.8 cm for WC. ACE-I, angiotensin-converting enzyme inhibitor; BMI, body mass index; HR, hazard ratio; WC, waist circumference.

