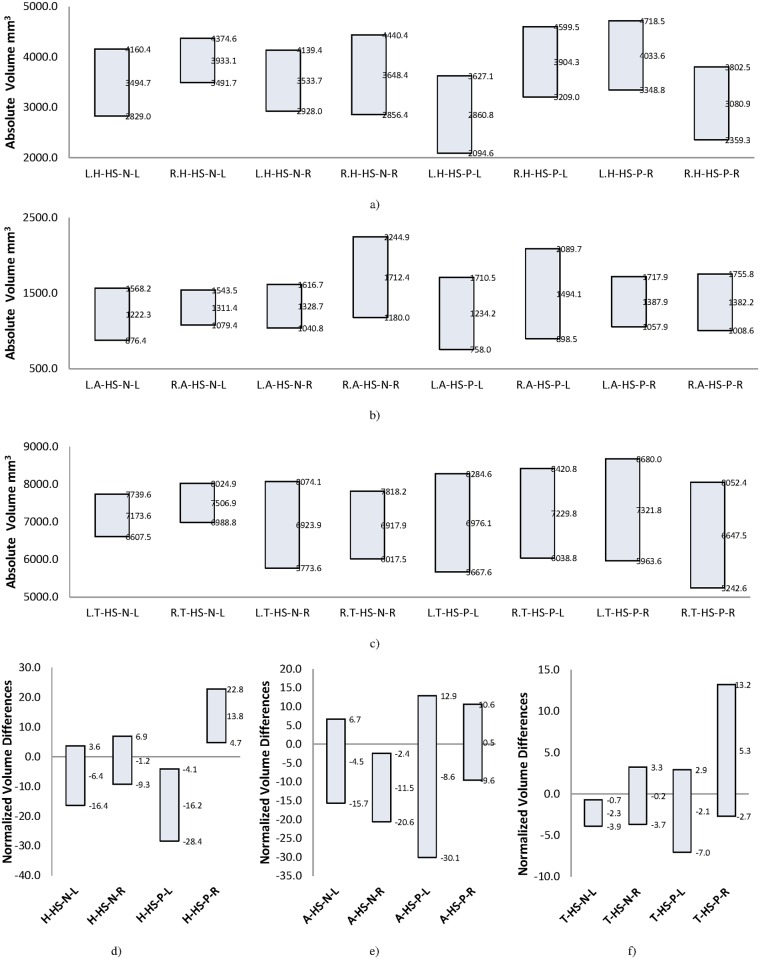
Fig 4. Mean ± SD range for volume of different structures in HS-P and HS-N groups.
a) Absolute volume of hippocampus. b) Absolute volume of amygdala. c) Absolute volume of thalamus. d) Normalized volume differences (atrophy) of hippocampus. e) Normalized volume differences of amygdala. f) Normalized volume differences of thalamus. Bar label pattern for a, b, and c is W.X-HS-Y-Z and for d, e, and f is X-HS-Y-Z where, W is the side of structure (L/R means left/right), X is the brain structure (H/A/T means Hippocampus/Amygdala/Thalamus), HS-Y identifies the group of patients (HS-N/HS-P) and Z is the side of epileptogenicity (L/R means left/right). For example: L.T-HS-P-R is Left Thalamus volume of cases with Hippocampal Sclerosis and Right side of epileptogenicity.

