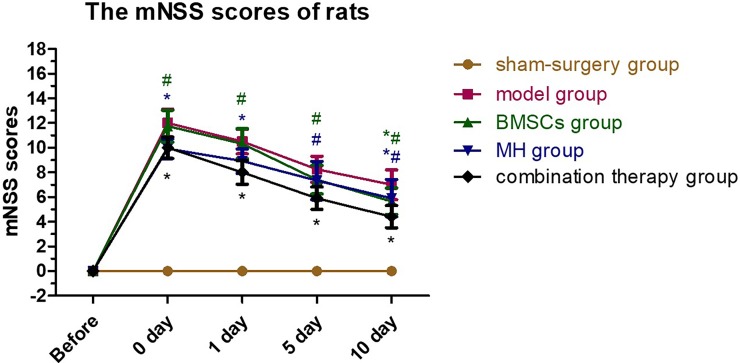
Fig 1. Variation tendency of rats mNSS scores.
Neurological functional tests were performed in each group at each time point (n = 6), respectively. The rats mNSS scores in the combination therapy group decreased more obviously than that in the BMSCs group. Values are expressed as mean± SE. *P < 0.05, compared to control; #P<0.05, compared with the combined therapy group.

