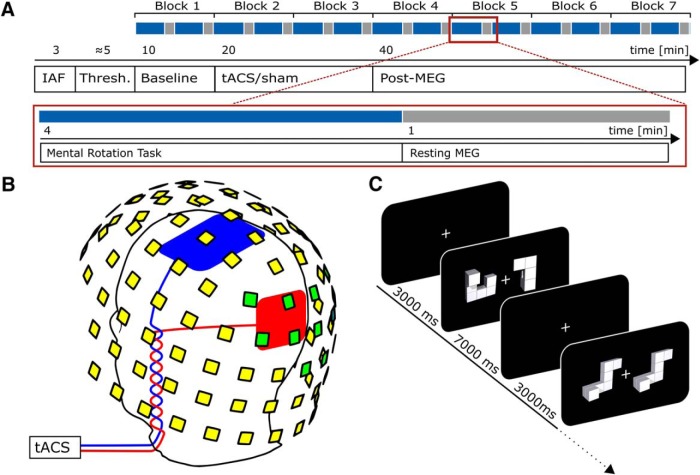
Figure 1.
Experimental procedures. A, Time course of the experiment. Blue indicates periods during which the MR task was performed; gray indicates intermittent resting periods. B, Positions of stimulation electrodes (red/blue) and layout of MEG sensors (yellow/green). Stimulation electrodes were placed centered above Cz (7 × 5 cm) and Oz (4 × 4 cm) of the international 10-10 system. MEG was recorded from 102 locations. Each location contains a sensor triplet of one magnetometer and two orthogonal planar gradiometers, resulting in a total of 306 channels. Sensor locations used to determine participants’ individual alpha frequency are marked green. C, Mental rotation task. Each trial started with the presentation of a white fixation cross at the center of the screen. After 3000 ms, a mental rotation stimulus (two objects) was presented and remained on screen for another 7000 ms. During this time participants were required to judge whether the two objects presented were either different (example depicted in 2nd display) or identical (but rotated; 4th display). A and C are adapted from Kasten and Herrmann (2017).

