Figure 3.
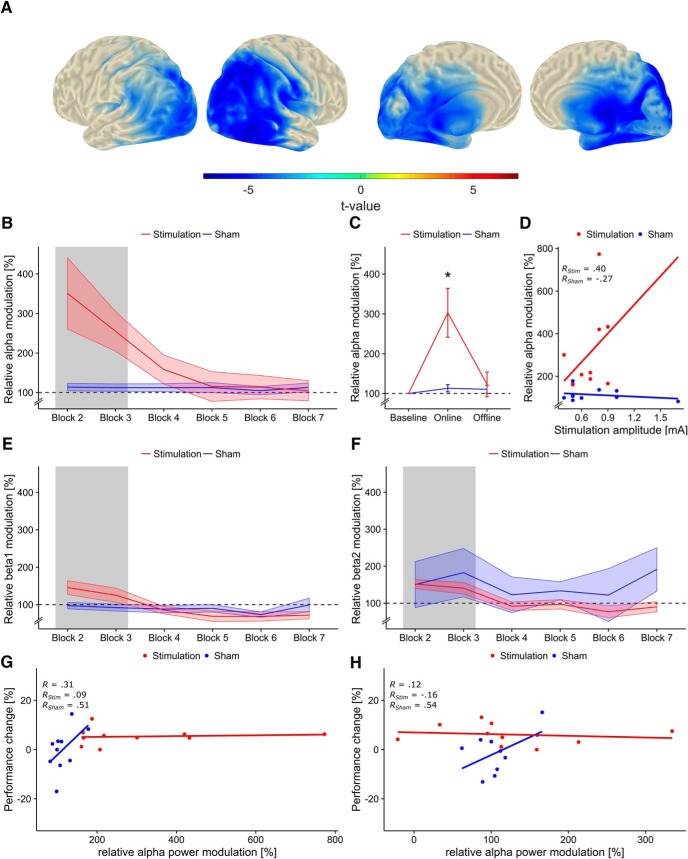
Event-related alpha-power modulation. A, Region of interest (ROI). Significant cluster (pre- vs. post-stimulus power) in the IAF-band during the first block before tACS or sham stimulation, computed over the whole sample (pcluster < 0.001). Topographies depict t-values mapped on an MNI standard surface. Statistical maps are thresholded at α < 0.01. The depicted cluster (blue) was used as ROI to extract the time course of alpha-power modulation, relative to baseline, over blocks from the virtual channels. B, Relative alpha-power modulation within ROI depicted for each block. The gray area indicates blocks during tACS or sham stimulation. Shaded areas represent standard error of the mean (SEM). Dashed line depicts baseline level. C, Relative alpha-power modulation during tACS or sham (online) and after stimulation (offline). Error bars represent SEM; asterisks code for significant differences (*, p < 0.05). D, Relative alpha-power modulation during stimulation correlated with stimulation intensity. Each point represents a single subject’s stimulation amplitude and relative alpha-power modulation, averaged over the two stimulation blocks (blocks 2 and 3). Please note that a stimulation intensity was determined for all participants (including sham); however, only participants in the stimulation group had this intensity continuously applied during blocks 2 and 3. E, Relative power modulation in the lower beta-band (IAF + 3 Hz to IAF + 11 Hz) within the ROI for each block. F, Relative power modulation in the higher beta-band (IAF + 12 Hz to IAF + 20 Hz) within the ROI for each block. G, H, Correlation between change in task performance and relative alpha-power modulation during (G) and after (H) tACS. High, albeit nonsignificant, correlations were evident for the sham group, but not the stimulation group.

