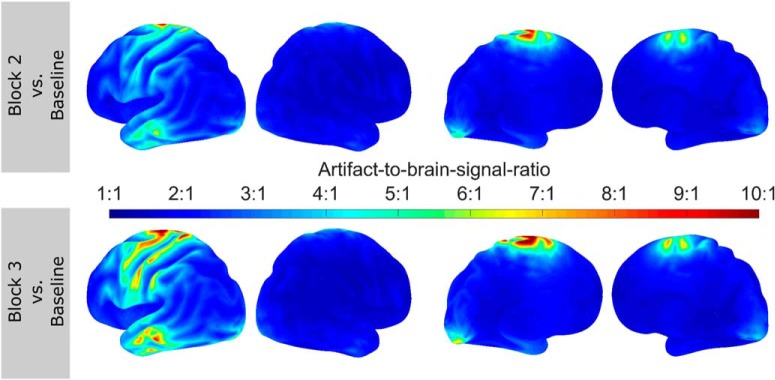
Figure 5.
Artifact-to-brain-signal topographies. Topographies depict the average ratio between participants’ pre-stimulus alpha-power, estimated during the baseline block, and residual artifact in the pre-stimulus interval during block 2 (top row) and 3 (bottom row). Results are depicted only for the stimulation group. The ratio is strongest in central areas covered by the stimulation electrodes and cables. Frontal and posterior areas within the ROI seem less affected, with the ratio falling in a physiologically plausible range (<1:4), such that residual artifact and facilitatory effects of the stimulation or spontaneous increase of alpha power cannot be disentangled. Results have to be interpreted in terms of an upper boundary for the size of the residual artifact, as each virtual channel contains a mixture of brain signal of interest and artifact.

