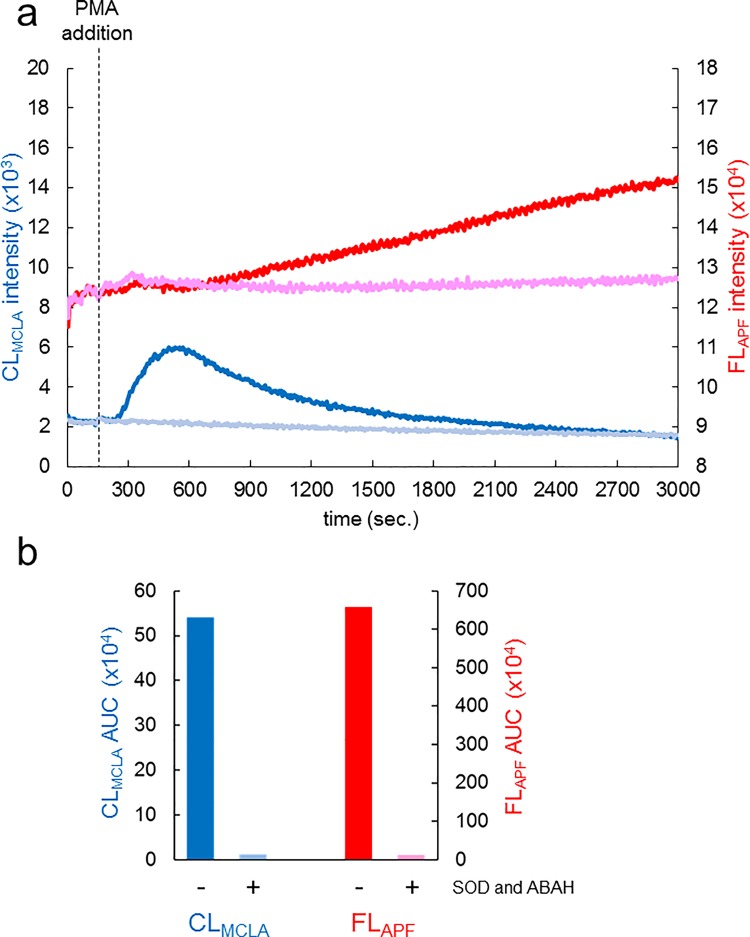
Fig 3. Measurements of CLMCLA and FLAPF in whole blood.
(a) Time courses of CLMCLA and FLAPF in whole blood. CFL-P2200 was used for the measurements. The left vertical axis indicates CLMCLA intensity; the right vertical axis, FLAPF intensity. The cell mixtures were treated with control vehicle (blue line for CL, red line for FL) or SOD and ABAH (pale blue line for CL with SOD, pink line for FL with ABAH). PMA was added at 150 second (dotted line). The baseline heights of FLAPF signals were adjusted for both the test sample (red line) and the sample including ABAH (pale pink line) making them start at the same level. (b) Calculated signal areas measured in (a). Increases in both CLMCLA and FLAPF were determined by calculating AUCs.

