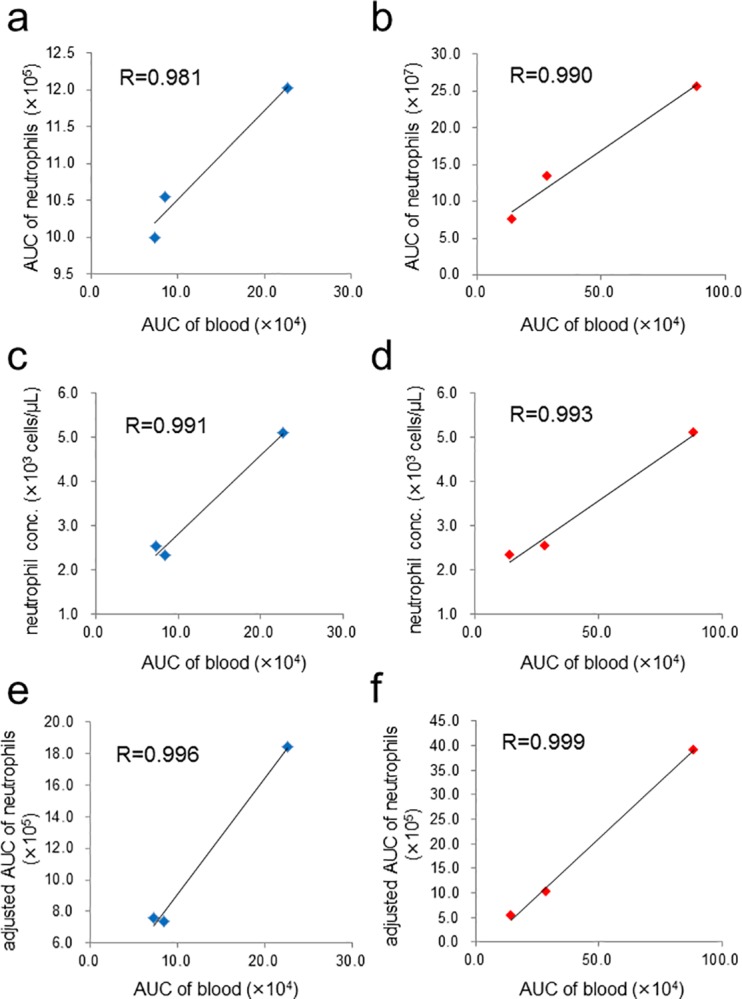
Fig 5. Correlations of the data sets of blood from 3 healthy volunteers.

(a) Scatter plot showing a very strong positive correlation between the AUCs of CLMCLA from 3 μl of whole blood (horizontal axis) and those from 1× 10⁴ cells of isolated neutrophils (vertical axis). (b) Scatter plot similarly obtained as in (a) with FLAPF intensities. (c) Scatter plot showing a very strong positive correlation between the AUCs of CLMCLA from 3 μl of whole blood (horizontal axis) and the neutrophil concentrations in whole blood (vertical axis). (d) Scatter plot obtained as described in (c) except that the horizontal axis is the AUCs of FLAPF from 3 μl of whole blood. (e) Scatter plot showing a very strong positive correlation between the AUCs of CLMCLA from 3 μl of whole blood (horizontal axis) and those from isolated neutrophils normalized by neutrophil counts in 3 μl of each blood (vertical axis). (f) Scatter plot obtained as described in (e) except that the horizontal axis is the AUCs of FLAPF intensities. CFL-P2200 was used for the monitoring of luminescence signals and Pentra MS CRP was used for measuring neutrophil concentrations in blood.
