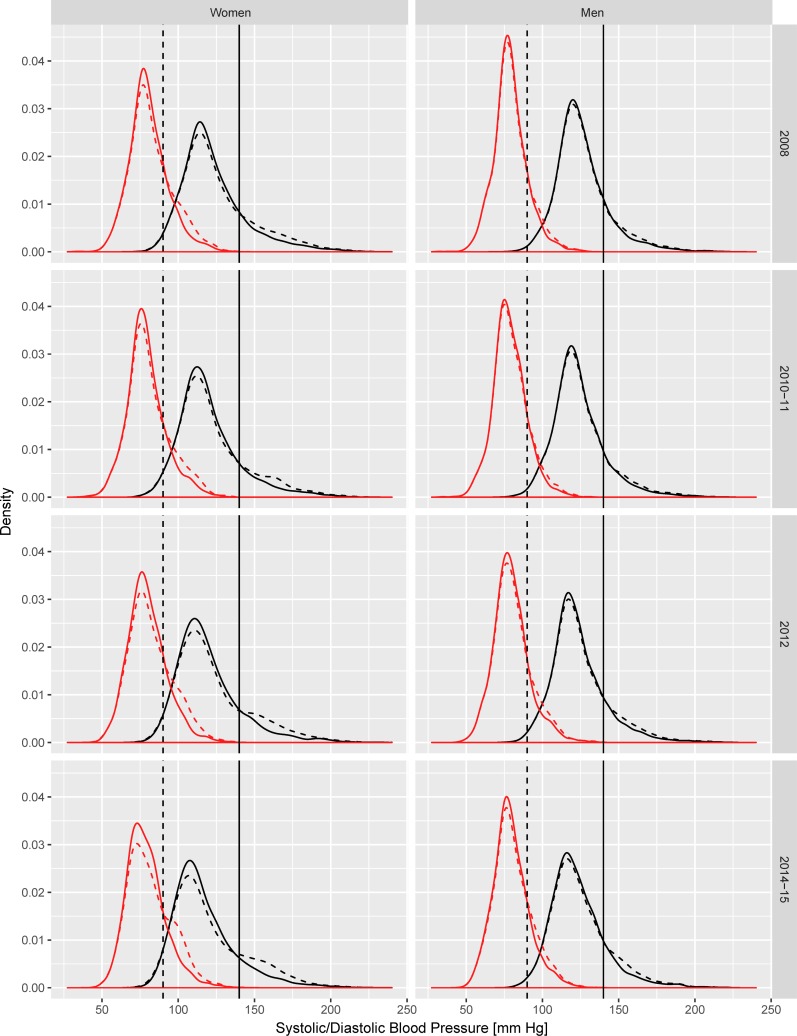
Fig 1. Season-adjusted observed and counterfactual distribution of systolic and diastolic blood pressure in the South African adult population (15 years and over), by gender.
Solid lines = observed distribution; Dashed lines = distribution in absence of treatment. The curves on the left side refer to DBP, those on the right side refer to SBP. Vertical lines represent the cut-off for diagnosis of diastolic (dashed line) and systolic (solid line) hypertension.

