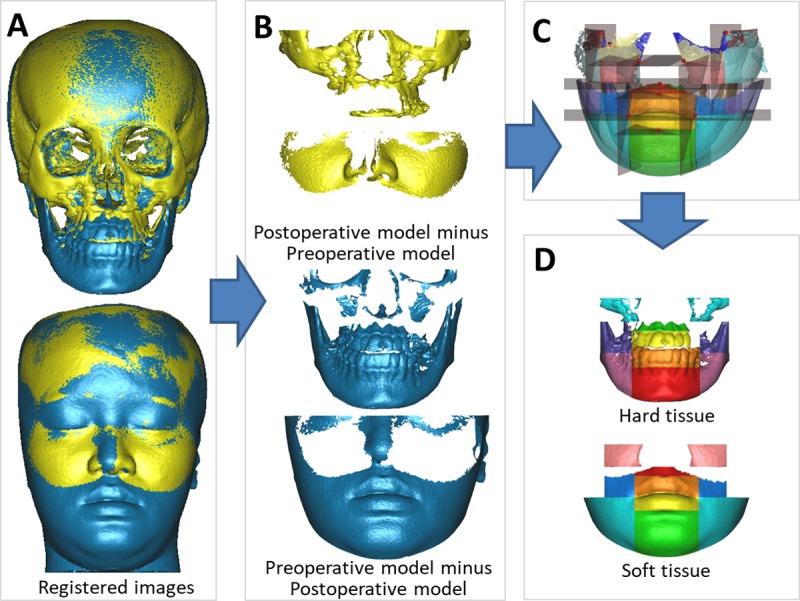
Fig 4. Volumetric difference of isolated soft and hard tissue regions.

Registered CBCT models (A), the volumetric differences after orthognathic surgery (B), the overall volumetric difference divided into 10 isolated regions based on the constructed planes (C), and 10 isolated regions of soft tissue and hard tissue (D).
