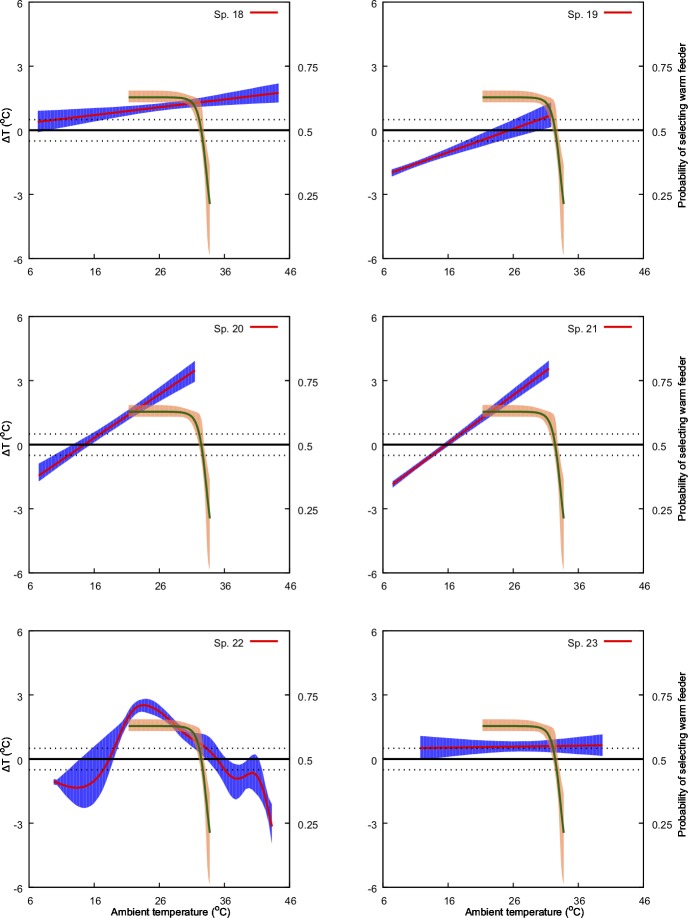
Fig 7. Predicted effect of ambient temperature (x-axis) on ΔT (primary y-axis: left-hand side) and on bee preference for warmer nectar reward (secondary, y-axis: right-hand side).
The model for ΔT is represented by the solid red line along with its 95% confidence region (shaded blue region). Solid green line represents the preference model along with its 95% confidence region (shaded orange region). Species numbers correspond to those in Table 1. Black, dotted lines indicate ΔT values of -1 and 1°C. Refer to Methods sections for details on the bee preference function.

