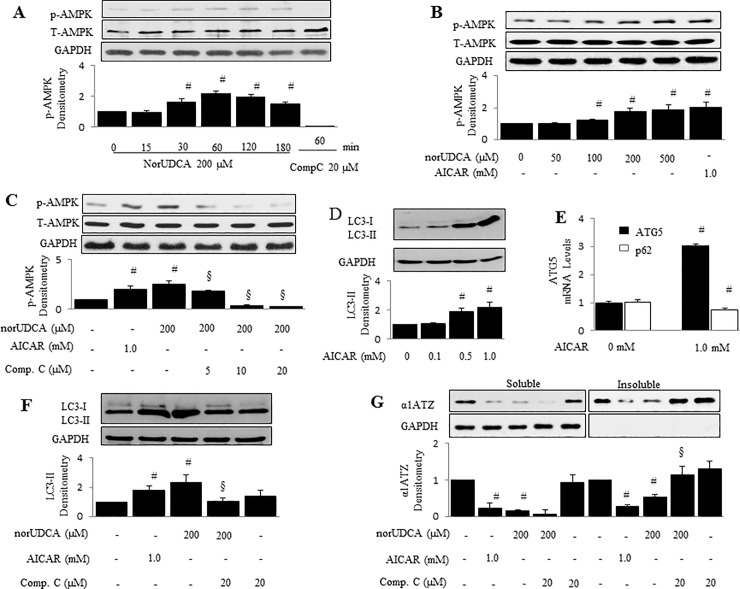
Fig 4. AMPK mediates norUDCA-induced α1ATZ polymer reduction and autophagy in HTOZ cells.
A & B. phosphorylation of AMPK (Thr172) in HTOZ cells treated with norUDCA at 200 μM for indicated time points (A) or at different doses for 1 hour (B) was determined by western blotting analyses. Compound C (20 μM) or AICAR (1.0 mM) was used as negative or positive control. Representative is from three independent experiments. C. Phosphorylation of AMPK (Thr172) in HTOZ cells pretreated with compound C at different concentrations (0–20 μM) for 1 hour prior to the presence of norUDCA at 200 μM for additional 1 hour was determined by western blotting analyses. AICAR (1.0 mM) was used as positive control. For A, B and C, the lower panels are the densitometry of phospho-AMPK after normalization with total AMPK. GAPDH is used as a loading control. Data is expressed as mean ± SD, #<0.05 vs untreated cells, and §<0.05 vs norUDCA treated cells alone. Representative is from three independent experiments. D. LC3 in HTOZ cells treated with AICAR at different concentrations (0–1.0 mM) for 24 hours was determined by western blotting analyses. E. mRNA levels of ATG5 and p62 were determined by real-time PCR in HTOZ cells treated without/with AICAR at 1.0 mM for 24 hours. Data is expressed as mean ± SD, # < 0.05 vs control, n = 3. F. LC3 in HTOZ cells treated with AICAR at 1.0 mM or norUDCA at 200 μM with/out compound C at 20 μM for 24 hours was determined by western blotting analyses. For D and F, the lower panels are the ratio of LC3-II/LC3-I. Data is expressed as mean ± SD, #<0.05 vs untreated cells, and §<0.05 vs norUDCA treated cells alone. Representative is from three independent experiments. G. A1ATZ polymers and monomers were isolated and determined by western blotting analyses in HTOZ cells treated with AICAR at 1.0 mM or norUDCA at 200 μM with/out compound C at 20 μM for 24 hours. The lower panel is the densitometry of α1ATZ after normalization with GAPDH. Data is expressed as mean ± SD, #<0.05 vs untreated cells, and §<0.05 vs norUDCA treated cells alone. GAPDH is used as an equal loading control. Representative is from three independent experiments.

