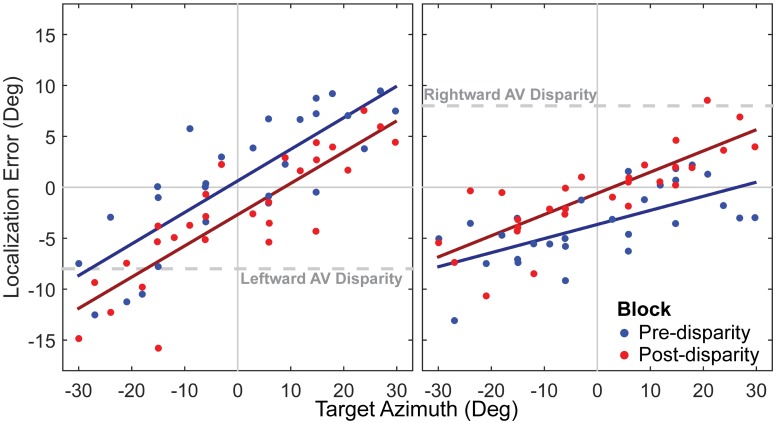
Fig 2. Example pre- and post-disparity auditory localization.
left panel, Localization responses from one subject before and after exposure to leftward (visual −8° azimuth relative to auditory) AV disparity. Blue and red circles represent localization response error as a function of target location in the pre-disparity and post-disparity blocks, respectively, and lines of the same color represent a linear fit to the data from each block. right panel, Shift in the same subject from exposure to rightward (visual +8° azimuth relative to auditory) disparity.

