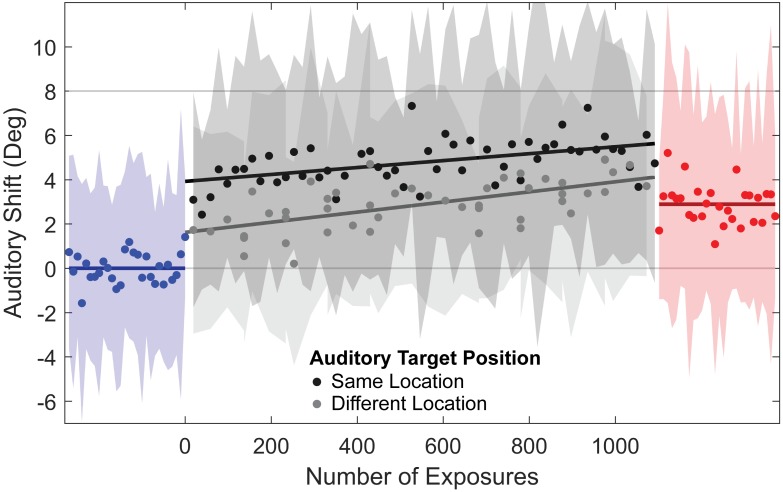
Fig 3. Evolution of auditory shift with repeated exposure to fixed AV disparity, averaged across subjects.
Blue and red points represent average relative error for pre-disparity and post-disparity, respectively. Black and gray points represent average relative error while localizing auditory targets during the exposure block, with black indicating localization of auditory targets presented 1–3 seconds after and 0° away from the auditory component of the AV disparity (“same location” targets), and gray indicating localization of targets presented more than 8 seconds after and at a different location than the auditory component of the AV disparity (“different location” targets). Blue and red lines indicate mean average relative error in the pre and post disparity blocks (with auditory shift defined relative to the pre-disparity localization responses for each session), gray lines show linear best fits to responses in the exposure block, and shaded regions represent ±1 standard deviation across subjects for each sample of the corresponding color.

