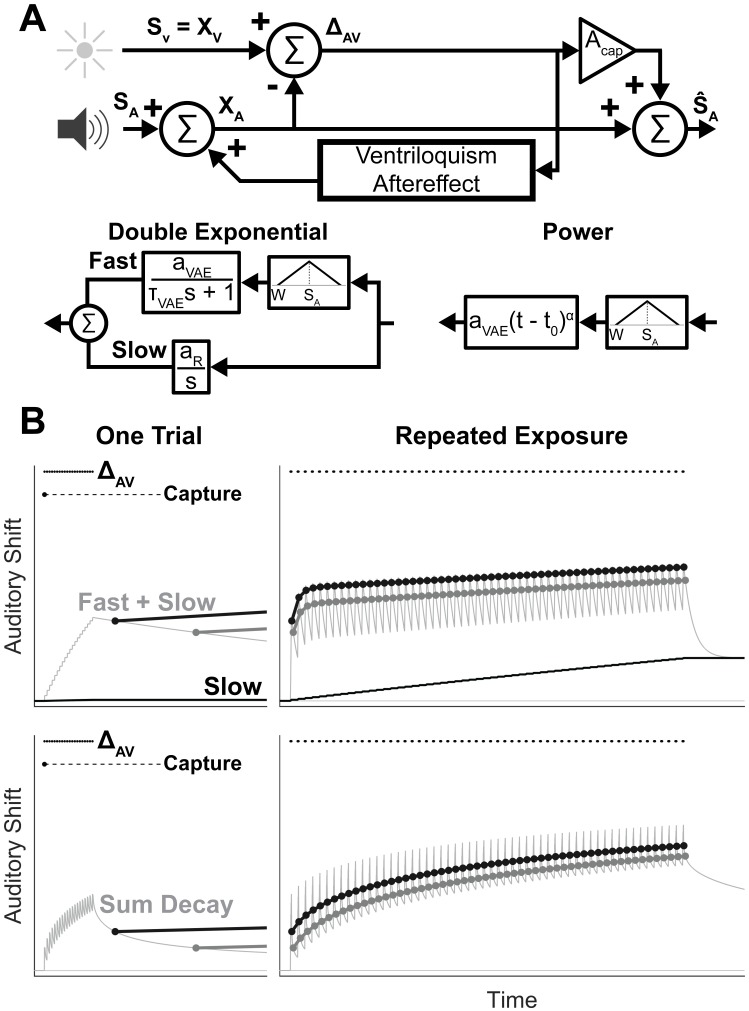
Fig 5. Model of the ventriloquism aftereffect.
A, Block diagram summarizing the state-space model, along with the double exponential and power models of the ventriloquism aftereffect. B, Example model responses to AV disparity trains. The top panels show the double exponential model, and the bottom panels show the power model. The left panels show how auditory shift builds and decays to a single AV disparity train (each dot represents a single repetition of the AV disparity). When auditory targets are presented following an AV disparity train, auditory shift influences the encoded location of the target (points and trend lines, colored to match Fig 3). Additionally, visual capture (not measured in the present experiment) occurs within the first AV disparity and can be held in memory indefinitely, as shown in [16]. The right panels show how both models can replicate the trends in auditory shift produced by repeated exposure to a fixed AV disparity observed in Fig 3. In both panels, median best fit model parameters across participants were used to produce the trends shown, to allow for visual comparison of model predictions. The effect of changing spatial location was not shown here to emphasize the changes in temporal relationship across the two models, so the difference in auditory shift across trial types appears smaller than in Fig 3.

