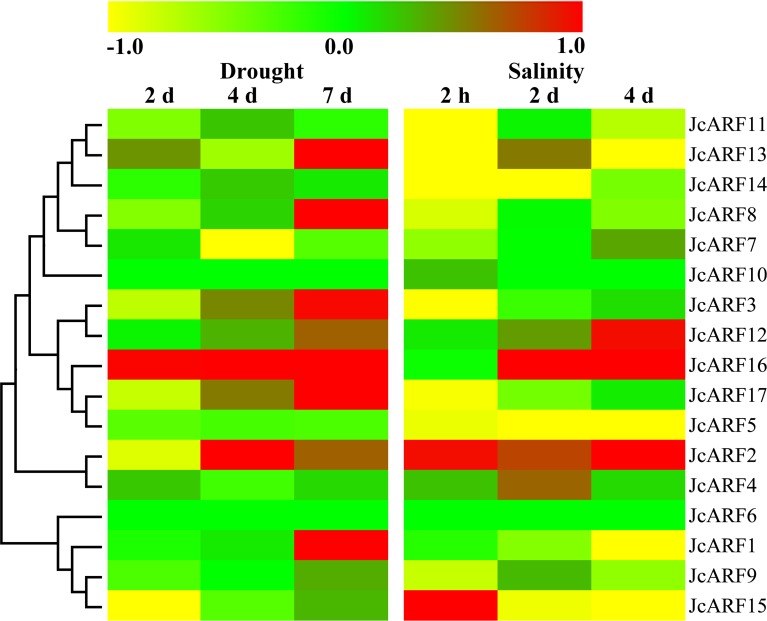
Fig 8. Expression analysis of 17 JcARF genes in leaves under drought and salinity stresses.
Log2 based values (signal values for treatment/signal value for control) were used to create the heat map based on transcriptomic data for ARFs. The color scale (representing signal values) is shown at the top.

