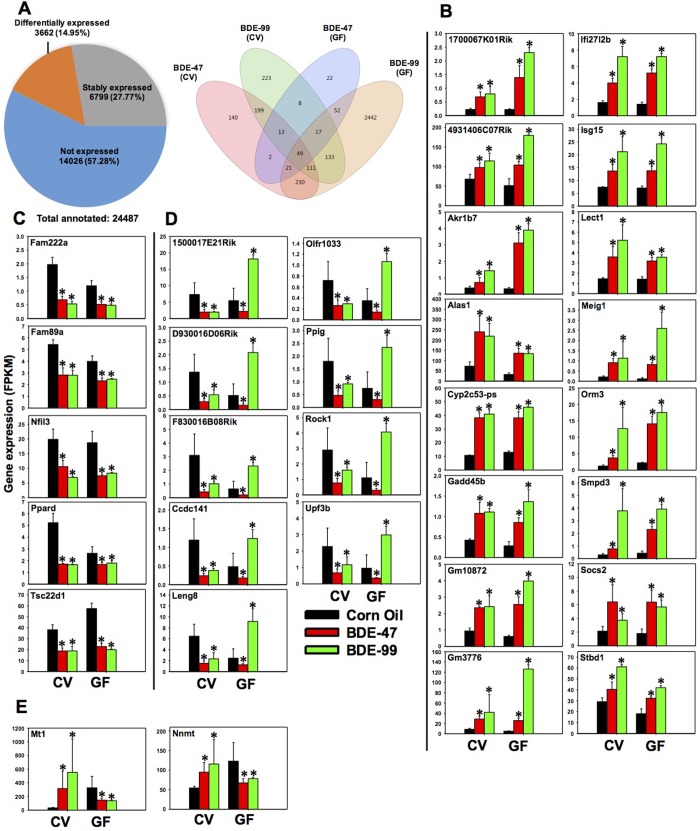
Fig 2. Regulation of protein-coding genes (PCGs) in livers of CV and GF mice exposed to corn oil, BDE-47 (100 μmol/kg), or BDE-99 (100 μmol/kg).
A. Left: a pie chart showing PCGs that were not expressed in any treatment groups (blue), stably expressed in all groups (grey), and differentially expressed by PBDE exposure in at least one of the four comparisons (orange). These four comparisons are: CV_CO (corn oil) vs CV_BDE-47; CV_CO vs CV_BDE-99; GF_CO vs GF_BDE-47; and GF_CO vs GF_BDE-99, FDR adjusted p-value <0.05). Right: a Venn diagram showing the differentially expressed PCGs that were commonly or uniquely regulated by PBDEs among the four comparisons as described in Fig 2A. Venn diagram was generated using JMP Genomics. B-E: PCGs that were differentially regulated by both PBDEs in livers of CV and GF mice. B. PCGs that were commonly up-regulated by BDE-47 and BDE-99 in livers of both CV and GF mice. C. PCGs that were commonly down-regulated by BDE-47 and BDE-99 in livers of both CV and GF mice. D. PCGs that were consistently down-regulated by BDE-47 in livers of CV and GF mice, but were oppositely regulated in CV (down-regulation) and GF (up-regulation) mice by BDE-99. E. PCGs that were oppositely regulated in CV (up-regulation) and GF (down-regulation) mice by both BDE-47 and BDE-99. Asterisks (*) indicate statistically significant differences as compared to vehicle-treated groups of the same enterotypes of mice (Cuffdiff, p < 0.05).

