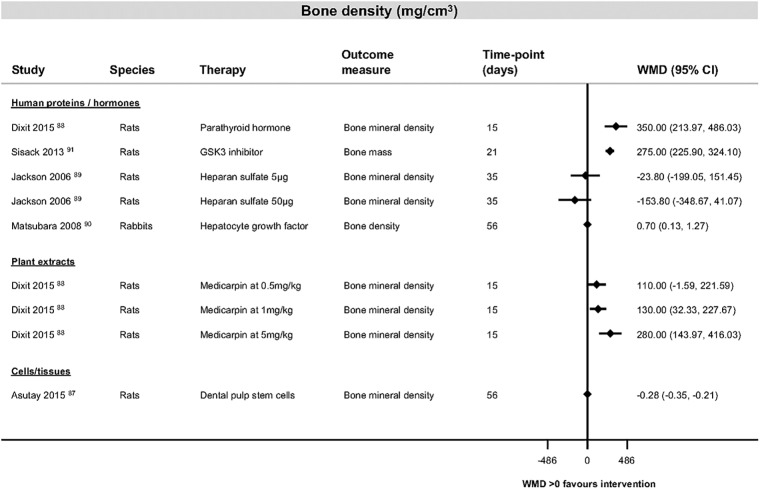
Fig 6. Bone density data for studies looking at interventions of human proteins and hormones, cells and tissues or plant extracts.
Forest plot illustrating mean difference in milligrams per cubic centimetre (mg/cm3) of bone density as measured by different histological or radiological measures. Abbreviations: CI, confidence interval; GSK3, glycogen synthase kinase 3; WMD, weighted mean difference.

