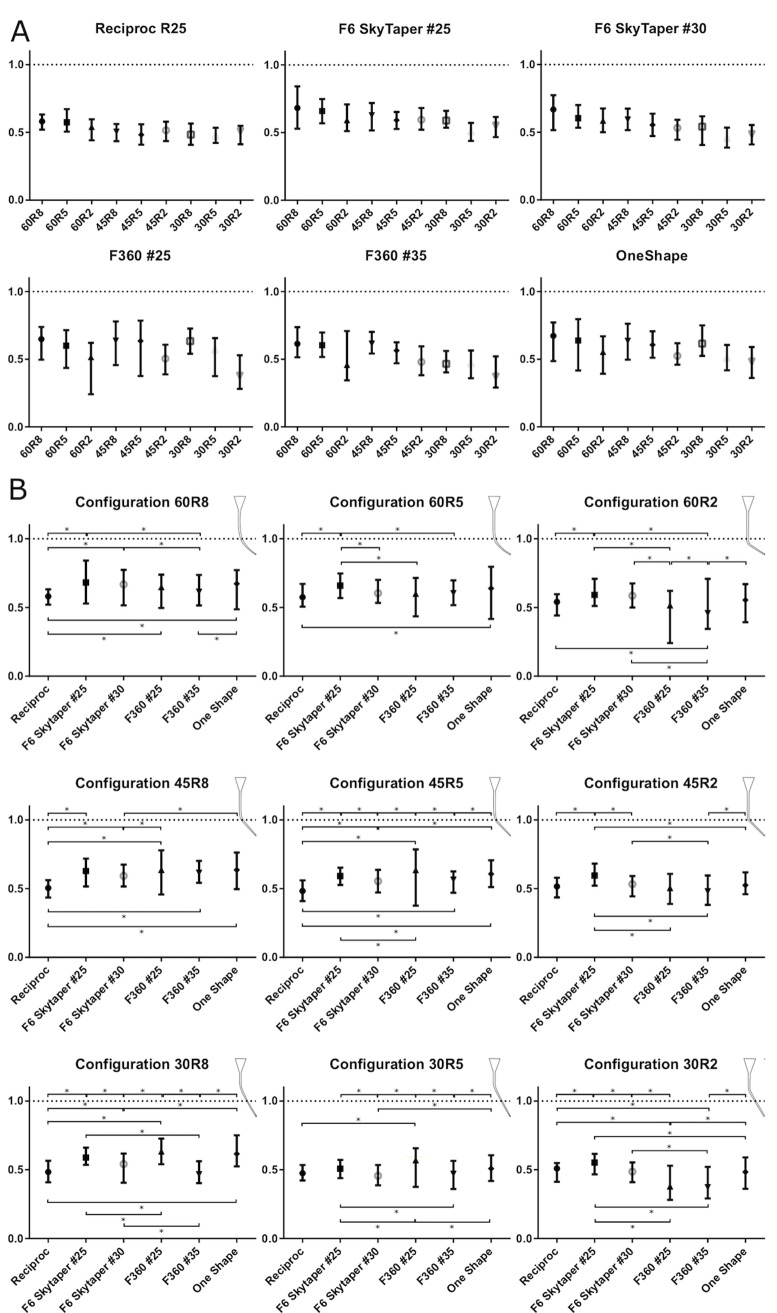
Fig 4.
A Error bar plots (symbol: mean value; whiskers: minimum and maximum value) of mean centering ratios for the different instrument systems used for the different root canal configurations. B Error bar plots of mean centering ratios for the different canal configurations with the different instrument systems. (Asterisks indicate significant differences (p<0.05).

