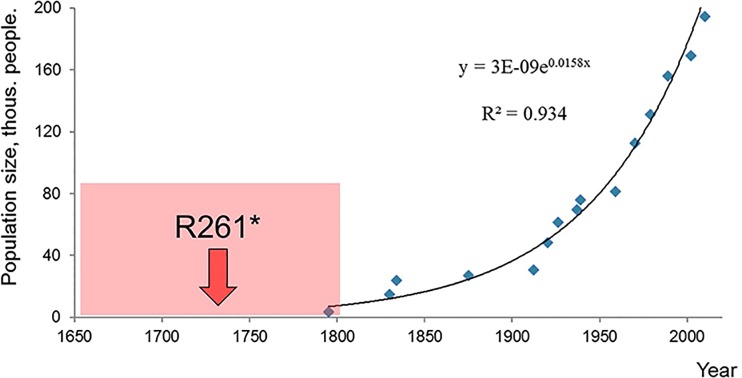
Fig 1. Karachay population dynamics from 1790 to 2010.
The dots indicate the population numbers of the Karachay population [27]. The curve is the approximation of exponential dependence on the graph of abundance versus time. The point of p.Arg261* origin is marked by an arrow; the error interval is in a square.

