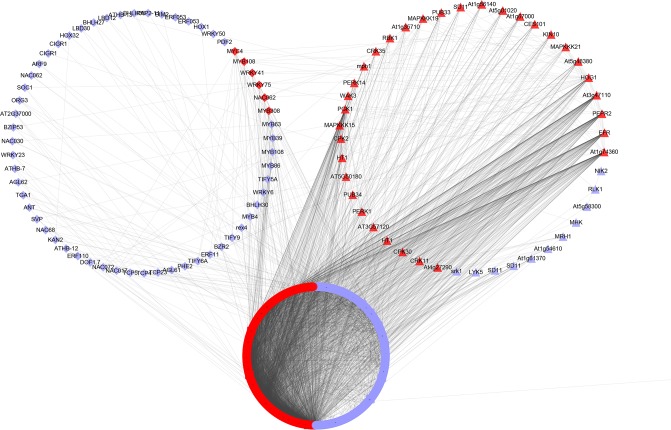
Fig 3. Protein-protein interaction network analysis for the top 2000 genes which showed a higher expression level in RG.
This interaction network for the top 2000 genes which showed a higher expression level in RG was created using STRING. Unconnected genes were removed, and the network was visualized in Cytoscape. The diamond nodes represent TFs, the triangle nodes represent PKs, and the TFs or PKs with more than 10 edges were indicated in red color.

