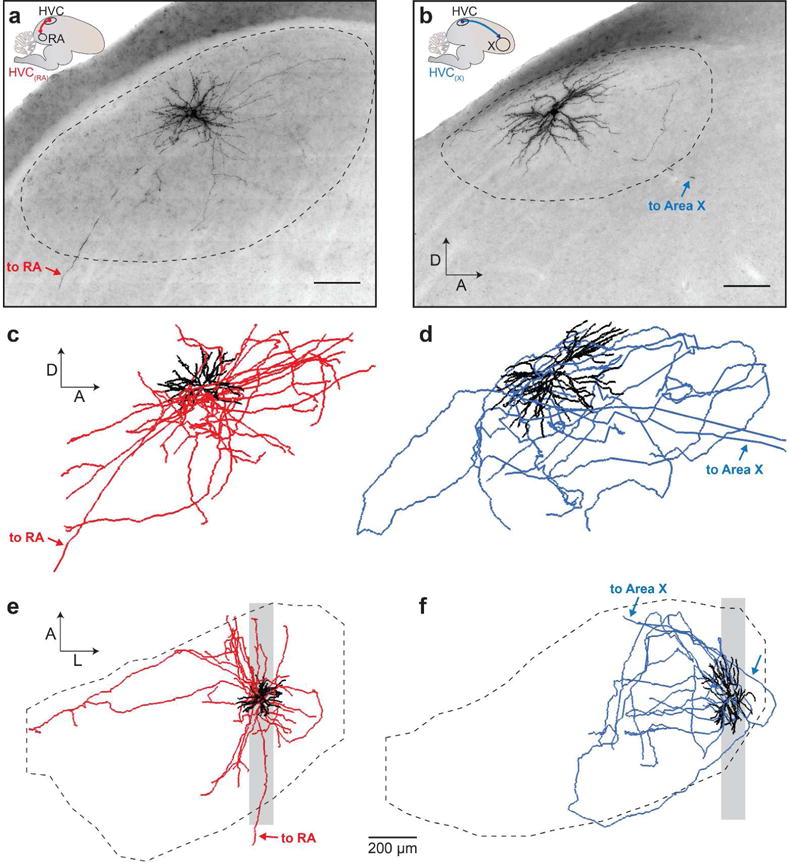
FIGURE 2. Anatomical reconstruction of HVC projection neurons.

(a, b) Micrographs show a projection of 100 μm sagittal sections of a DAB-stained HVC(RA) neuron (a) and HVC(X) neuron (b). Scalebars: 100 μm. (c, d) Complete reconstructions of the above neurons shown in the sagittal plane. Scale of reconstructions is matched with micrographs in (a, b). (e, f) Same cells as in (c) and (d), shown in the horizontal plane. Shaded region marks the area shown in the micrographs (a,b). Dendrites are represented with black lines, and axons are either red (HVC(RA)) (a) or blue (HVC(X)) (B). Dotted lines mark HVC boundaries in (a, b, e, f). Arrows indicate descending axons.
