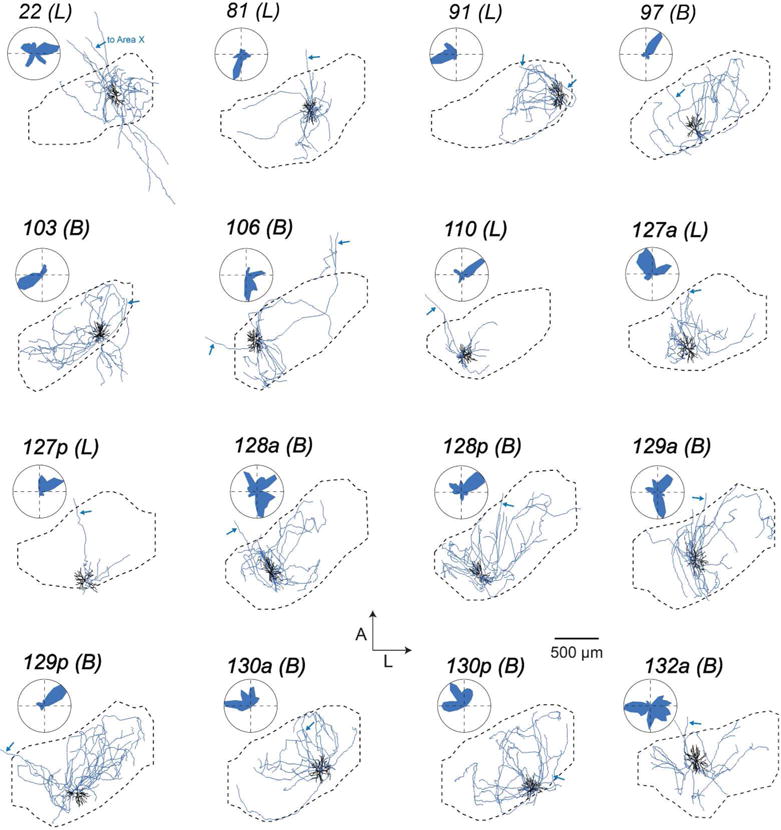
FIGURE 7. Local processes of HVC(X) neurons.

Each panel shows the dendrite (black) and local axons (blue) of all HVC(X) neurons projected on the horizontal plane and its position within HVC with accompanying polar plots quantifying axonal distribution. Arrows mark descending axon to Area X. ‘Local’ (L) and ‘broadcast’ (B) designations given in parentheses (see Figure 11 and Materials and Methods).
