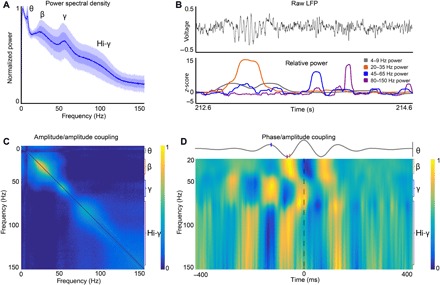
Fig. 1. Beta, gamma, and hi-gamma transients occur within a temporal framework that is referenced to theta.

(A) Average power spectral density plots for 36 recordings from four animals. Dark and light transparent shadings represent 1 and 2 SDs, respectively. We calculated the plots using LFP data from the entire recording sessions (~25 to 40 min). Power spectral density plots were also remarkably consistent across recording days in single individuals (fig. S2A). (B) Example of 2-s raw LFP trace (black), and z-scored power at theta (gray; 4 to 9 Hz), beta (orange; 20 to 35 Hz), gamma (blue; 45 to 65 Hz), and hi-gamma (magenta; 80 to 150 Hz) frequency bands. (C) Average power/power correlations for all animals across all frequencies, showing that there are multiple frequency bands that are correlated within a given range but independent from other frequency ranges. Color axis, 0 to 0.5. (D) Phase/amplitude coupling to theta (4 to 9 Hz) frequency. We plotted the average theta wave, aligned by the peaks, across all recordings as the gray line. The colormap represents the average wavelet transform relative to the peak of theta. Beta (20 to 35 Hz) and hi-gamma (80 to 150 Hz) frequencies increase in amplitude during troughs in theta, while gamma power (45 to 60 Hz) increases at the peak of theta oscillations. Orange, blue, and magenta ticks on the average theta wave indicate maximum power for beta, gamma, and hi-gamma frequency bands, respectively. Black vertical bar for theta wave, −2 to +2 μV. Values at each frequency are normalized to the highest value at the same frequency. Color axis, 0 to 1.
