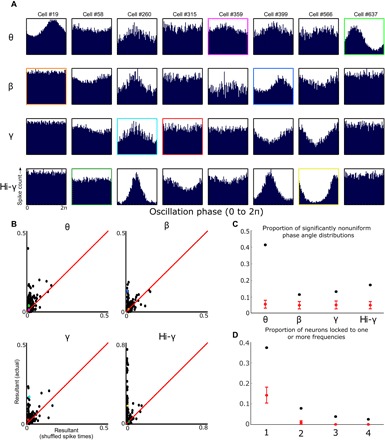
Fig. 2. Individual BF neurons phase-lock to specific frequency bands.

(A) For each example neuron (columns), there are four plots (rows) that show the spike time histograms relative to the phase of theta, beta, gamma, and hi-gamma oscillations. Colored boxes map onto the colored dots in (B). (B) For each neuron, we calculated resultant vectors for the distribution of phase angles at spike times and for randomized spike times (average of 100 iterations). Scatterplots depict the actual resultant vector (y axis) and the average resultant vector with randomized spike times (x axis) for each neuron. Red lines indicate a slope of 1, and colored dots map onto the colored outlines in (A). Light green, blue, teal, and yellow dots correspond to strongly phase-locked neurons for theta, beta, gamma, and hi-gamma, respectively; while magenta, orange, red, and dark green dots correspond to neurons with weak or no modulation for theta, beta, gamma, and hi-gamma, respectively. (C) For each neuron, we then used Rayleigh’s test for nonuniformity to determine whether spike times were uniformly distributed or locked to particular phases of theta, beta, gamma, or hi-gamma oscillations. The proportion of neurons with P < 0.05 is represented as the black dots for each frequency band. The mean proportion of neurons with P < 0.05 when spike times are randomly shuffled (100 iterations; error bars are ±3 SDs) is shown in red. (D) The proportion of neurons with significantly nonuniform spike phase distributions for one, two, three, or four of the observed frequency bands is shown as black dots. The proportion of neurons with P < 0.05 for one, two, three, or four frequency bands when spike times are randomly shuffled (100 iterations; error bars are ±3 SDs) is shown in red.
