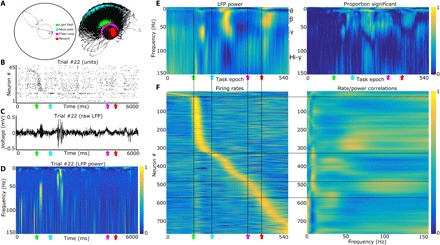
Fig. 3. Neuronal firing is correlated with the oscillation amplitude of specific frequency bands.

(A) Example tracking data from a single trial (left) and 24 recordings (right). We detected the head location via two head-mounted light-emitting diodes (LEDs) (black dots). Green, cyan, magenta, and red dots indicate the head location during the light flash, nosepoke, plate cross, and reward location, respectively. (B) Example spike trains from 45 simultaneously recorded BF neurons across a single trial. (C) Raw LFP trace from the same example trial as in Fig. 2B. (D) Wavelet transform of LFP trace in Fig. 2C. Note the gamma and beta transients after the light flash and nosepoke, respectively (color axis, 0 to 1; maximum normalization performed individually for each frequency bin). (E) Left: Average wavelet transform of LFPs recorded during the selective attention task. Changes in LFP power during the task can be observed across all four frequencies: theta (4 to 9 Hz), beta (20 to 35 Hz), gamma (45 to 60 Hz), and hi-gamma (80 to 150 Hz). All frequencies (rows) are individually maximum-normalized (color axis, 0 to 1) to visualize changes across the spectrum of frequencies present. Right: Proportion (color axis, 0 to 1) of recordings with LFP power fluctuations that were significantly different from equal length segments randomly selected from the recording for all frequencies (1 to 150 Hz) and task epochs (1 to 540 Hz). Note that both significant increases and decreases (hi-gamma during return) in power are observed during specific task epochs. KS tests thresholded at P < 0.05. (F) Left: Mean firing rates for 780 BF neurons. Each row is the average firing rate (~70 trials) for a single neuron; the population is sorted by the point of maximum firing during the selective attention task (color axis, 0 to 1; with each maximum normalization performed individually for each row/neuron). Right: Neurons with specific firing patterns, relative to epochs of the selective attention task, correlate with specific frequency bands in the LFP (left). For each trial, we correlated the cross-epoch firing rate vector for each neuron (Pearson’s product-moment correlation) with the wavelet transform of the LFP across the same epochs. These correlations are then averaged across trials, generating a matrix where the y axis is the neuron number (1 to 780) and the x axis is the LFP frequency (1 to 150 Hz). The rows of this correlation matrix are then sorted to match the order of (E), maximum-normalized, and smoothed with the nearest 30 neurons (moving window along the y axis; color axis is between 0 and 1). For comparison with correlation values expected by chance, see fig. S4. Black vertical lines [across (E) and (F)] mark the light flash, nosepoke, plate cross, and reward, while the black horizontal lines [across (E) and (F)] mark the neurons with peak firing rates closest to these behaviorally defined events.
