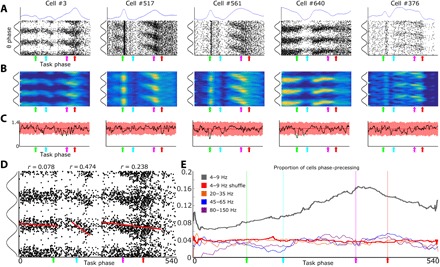
Fig. 4. BF neurons theta phase precess across task epochs.

(A) Scatterplots, for five example cells, of spike times relative to LFP theta phase (y axis) and task epoch (x axis). To aid visualization, theta cycles are repeated three times on the y axis, and colored arrows depict behavioral events on the x axis (green, light; cyan, nosepoke; magenta, plate cross; red, reward). Above the scatterplots, blue lines represent the average firing rate for each neuron across the selective attention task (normalized to maximum rate; y axis is 0 to 1). (B) Spike density heat maps of the data given in Fig. 3A. (C) Theta phases are uniformly distributed across task epochs. Circular SDs of theta phases are plotted in black, and those expected by chance are plotted in red (10× shuffled; bounded line is a 99% confidence interval). Green dots depict the few task epochs with nonuniform theta phase distributions. (D) Example cell #3 is depicted again with circular-linear correlations plotted as the slope for each of its firing fields (epochs 1 to 138, 185 to 251, and 291 to 502) (see Materials and Methods for firing field definition). Note that its second and third firing fields display strong circular/linear correlations between theta phase and task epoch. (E) Proportion of neurons that are active (>50% maximum firing rate) and also exhibiting significant phase precession as a function of task epoch. For each task epoch (x axis), all significant theta precessing firing fields with centers of mass within ±10 epochs were summed (y axis). Gray line indicates precession relative to 4- to 9-Hz theta. Orange, blue, and magenta lines indicate precession relative to beta, gamma, and hi-gamma, respectively. Red line indicates the proportion of neurons expected by chance to be precessing at each task epoch relative to 4- to 9-Hz theta.
