. 2018 Jul 18;7:e32948. doi: 10.7554/eLife.32948

Figure 3. Single-cell analysis of nucleation and spreading using a Fission Yeast Lifespan Micro-dissector (FYLM).

(A) Overview of the FYLM-based heterochromatin spreading assay. The old-pole cell is trapped at the bottom of one of hundreds of wells in the FYLM microfluidic device and is continuously imaged in brightfield (to enable cell annotation), green, orange and red channels. Hypothetical example traces are shown. (B) Maximum values attained by each nucleated cell for normalized ‘orange’ plotted against normalized ‘green’. Solid horizontal lines correspond to y = 0 and y = 0.5. Dashed line corresponds to an ON cutoff determined by mean less three standard deviations for each strain’s matched Δclr4 strain. Percentage of cells between each line was calculated. (C) FYLM analysis of wild-type MATHSS cells. CELL TRACES: 60 hr of normalized ‘green’ (left) and ‘orange’ (right) fluorescence in cells that maintained nucleation with the same five cells overlaid in different gray line styles in both plots. Gaps indicate loss of focus. HEATMAP: Up to 36 hr of normalized ‘orange’ fluorescence for 30 cells that maintained nucleation is represented from blue (0) to yellow (1). X-Y FLUORESCENCE PLOT: for one representative sample cell, plot of normalized ‘green’ and ‘orange’ fluorescence across its measured lifetime (grayscale). (D) FYLM analysis of ΔREIIIHSS cells as in C. The example cell in the X-Y dot plot is marked with an asterisk(*) on the orange traces (E) FYLM analysis of ΔKHSS-OFF isolate, as in C., D. All cells were normalized to Δclr4 (max, 1).

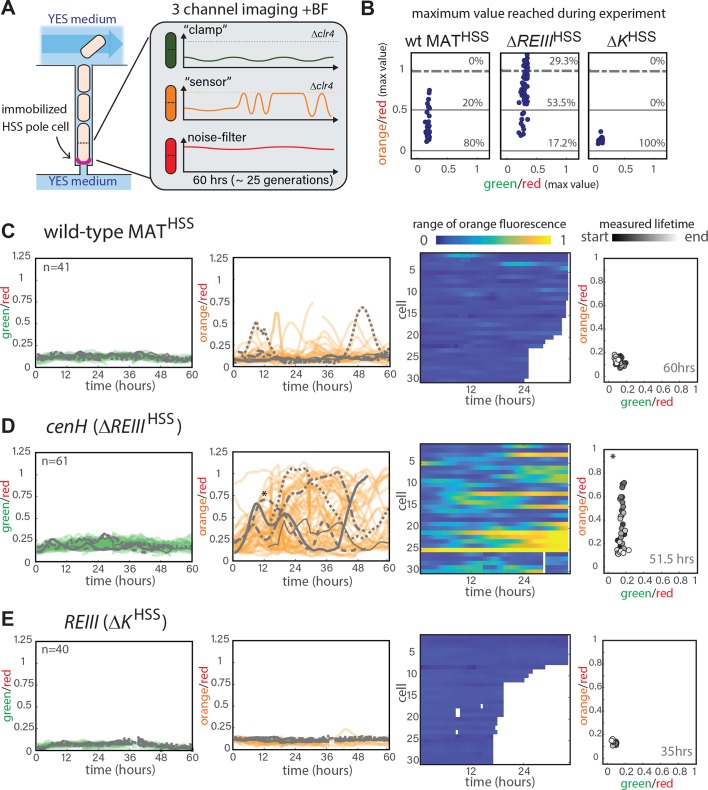
Figure 3.

Figure 3—figure supplement 1. Single-cell analysis of nucleation and spreading using a Fission Yeast Lifespan Micro-dissector (FYLM).

Figure 3—figure supplement 1.

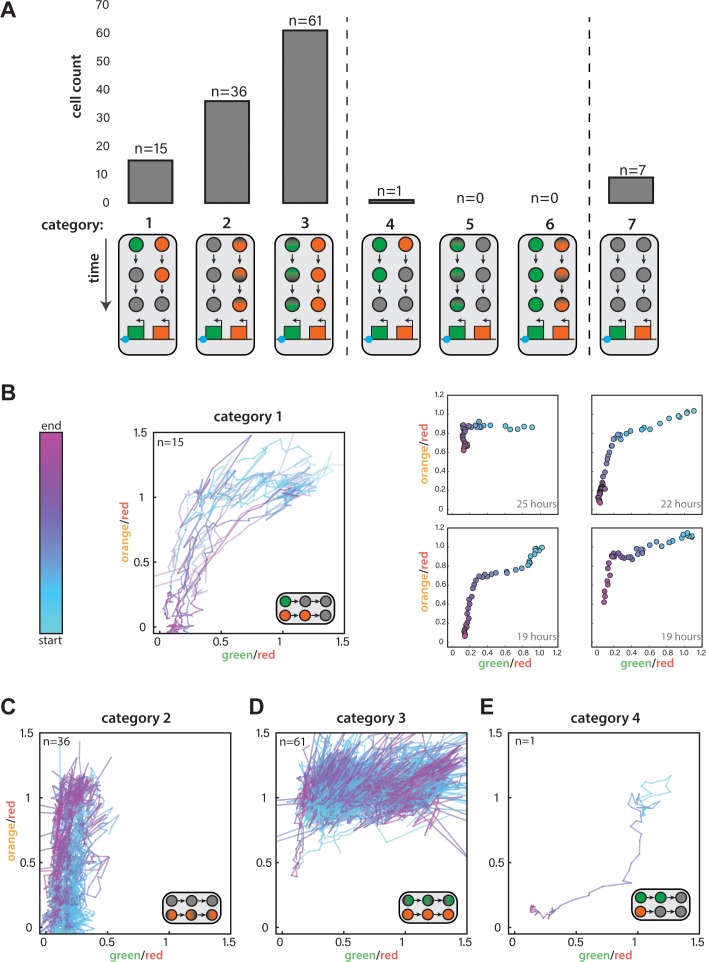
(A) For ura4::dhHSS3kb FYLM experiments, counts of cells in each of seven categories. Diagrams indicate the time-dependent silencing behaviors of cells in each category. Categories 1–3 are consistent with proximal to distal silencing, whereas categories 4–6 are consistent with a distal to proximal silencing. (B) Time-dependent traces showing cells from Category 1 where the normalized ‘green’ and ‘orange’ values at each time point are plotted color-coded by time where blue and pink represent the start and end of the measurement, respectively. LEFT: Traces for all Category 1 cells, which begin at the start of the silencing event with both colors fully expressed and end when both colors have reached their local minimum. RIGHT: Four example cells where points represent 30-min time points colored from the start to end of the event. The duration of the time represented is indicated in the lower right corner. (C) Traces for Category 2 cells during their entire measured lifespan. (D) Traces for Category 3 cells during their entire measured lifespan. (E) Time-dependent traces for the one cell in Category 4. Lines are plotted and time is curated as in (B).
Figure 3—figure supplement 2. Single-cell analysis of nucleation and spreading using a Fission Yeast Lifespan Micro-dissector (FYLM).

Figure 3—figure supplement 2.

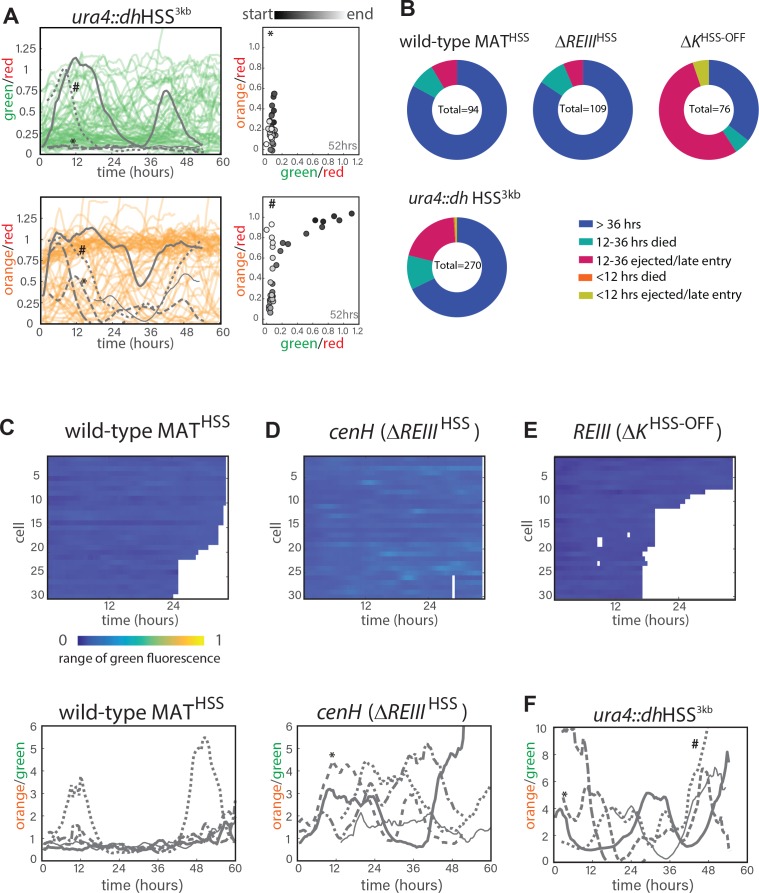
(A.) FYLM analysis of ura4::dhHSS3kb cells. TOP LEFT: 60 hr of normalized ‘green’ fluorescence, a subset of cells are shown for clarity. five example cells are overlaid in gray each with different line types. BOTTOM LEFT: 60 hr of normalized ‘orange’ fluorescence in the matching subset of cells with the same five overlaid in gray. *, # represent two example cells. RIGHT: for two representative sample cells imaged, plots of normalized ‘green’ and ‘orange’ across its measured lifetime (grayscale). The corresponding cells are marked in the orange traces on LEFT. (B) Categorization of cell longevity of all cells analyzed in the FLYM experiment. Measured lifespan ends when a cell dies or is ejected from its capture channel. (C) For wild-type MATHSS TOP: ‘green’ fluorescence heatmap (blue (0) to yellow (1)) for the same 30 cells as in 3C. BOTTOM: 60 hr of traces for ‘orange’ divided by ‘green’ for the five example cells indicated in 3C. (D) ‘green’ fluorescence heatmap and ‘orange’/”green’ traces for ΔREIIIHSS as in C. (E) ‘green’ fluorescence heatmap ΔKHSS as in C. (F) ‘orange’/”green’ traces for ura4::dhHSS3kb as in C. *, # indicate the same cells as in A.
Figure 3—video 1. Cell #274 from strain PAS244.
Download video file (249KB, mp4)
DOI: 10.7554/eLife.32948.010
This movie consists of imaging in four channels, listed from top to bottom: Bright field, ‘green’, ‘orange’, and ‘red’ for cell #274 from the strain PAS244 ura4HSS3kb. X-Y fluorescence plot for this cell is shown in Figure 3—figure supplement 2A, top right.
Figure 3—video 2. Cell #271 from strain PAS244.
Download video file (219.8KB, mp4)
DOI: 10.7554/eLife.32948.011
This movie consists of imaging in four channels, listed from top to bottom: Bright field, ‘green’, ‘orange’, and ‘red’ for cell #271 from the strain PAS244 ura4HSS3kb. X-Y fluorescence plot for this cell is shown in Figure 3—figure supplement 2A, bottom right.
Figure 3—video 3. Cell #350 from strain PAS389.
Download video file (582.8KB, mp4)
DOI: 10.7554/eLife.32948.012
This movie consists of imaging in four channels, listed from top to bottom: Bright field, ‘green’, ‘orange’, and ‘red’ for cell #350 from the strain PAS389 WT MATHSS. X-Y fluorescence plot for this cell is shown in Figure 3C. Fluctuations of colors in this video occur over a narrow range (see Figure 3C RIGHT) and are amplified due to relative scaling in the video with respect to background.
Figure 3—video 4. Cell #407 from strain PAS391.
Download video file (210KB, mp4)
DOI: 10.7554/eLife.32948.013
This movie consists of imaging in four channels, listed from top to bottom: Bright field, ‘green’, ‘orange’, and ‘red’ for cell #407 from the strain PAS391 ΔREIIIHSS. X-Y fluorescence plot for this cell is shown in Figure 3D.
Figure 3—video 5. Cell #123 from strain PAS387.
Download video file (190.4KB, mp4)
DOI: 10.7554/eLife.32948.014
This movie consists of imaging in four channels, listed from top to bottom: Bright field, ‘green’, ‘orange’, and ‘red’ for cell #123 from the strain PAS387 ΔKHSS. X-Y fluorescence plot for this cell is shown in Figure 3E.