
Author response image 1. Exceedingly few cells are “green”ON and “orange”OFF.
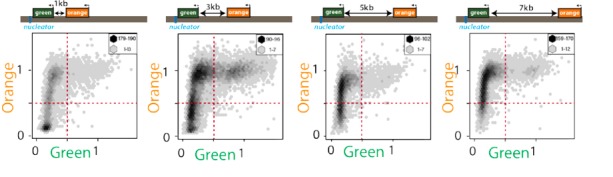
2D hexbin plots of cells (max and min bin cell numbers indicated) with ectopic nucleation site (“green” nucleation proximal, “orange” distal at indicated distances, see Figure 1C). Fluorescence of all cells gated for cell size is plotted and normalized by “red” with no green or orange filtering. Note the very small number of cells detectable in the bottom right quadrant.