. 2018 Jul 25;7:e31755. doi: 10.7554/eLife.31755

Figure 4. NLG1-ΔCter expression strongly impaired synaptic transmission efficacy.

(A) Example of mEPSC traces recorded in cultured neurons expressing either GFP, GFP + NLG1-ΔCter or GFP + NLG1. (B) Cumulative distribution and (C) average of the mEPSC amplitude recorded on neurons expressing GFP (dark), GFP + NLG1-ΔCter (red) or GFP + NLG1 (green) (n = 14; 14 and 13 respectively). mEPSCs amplitude is decreased by 25% in neurons expressing NLG1-ΔCter. (D) Scheme of the patch clamp protocol used to record asynchronous EPSC on organotypic hippocampus slices. Two neighboring neurons are simultaneously patched, one transfected and one non transfected, Schaffer collateral connecting both neuron are then stimulated. (E and F) Representative traces of asynchronous EPSCs recorded in the presence of strontium, of either a control and a NLG1-ΔCter expressing neuron (E) or a control and a NLG1 (F). To avoid multi synaptic responses, 50 ms following the stimulation are excluded from the analysis. (G) Cumulative distribution of aEPSCs amplitude recorded from control (dark),or neurons expressing GFP + NLG1-ΔCter (red) or GFP + NLG1 (green) (n = 8 and 6 pairs of cells, respectively). Average of aEPSCs amplitude, with connection between the transfected cell and their respective neighboring non transfected control, when either GFP + NLG1 (H) or GFP + NLG1-ΔCter (I) are expressed. NLG1-ΔCter expression decreased by 25% the average aEPSCs amplitude.

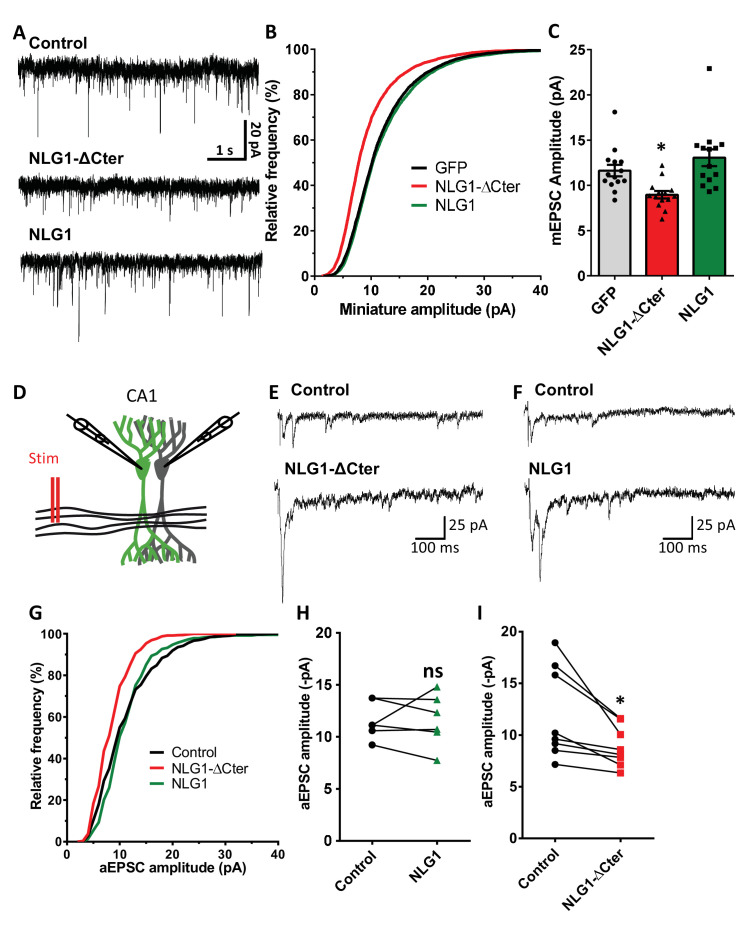
Figure 4.

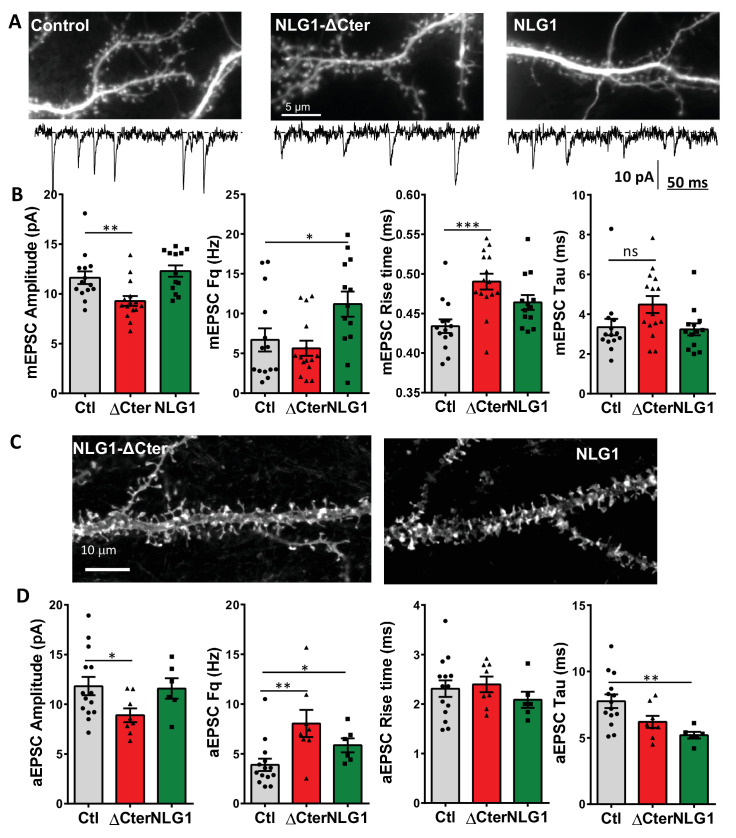
Figure 4—figure supplement 1. Neuroligin 1 and NLG1-ΔCter expression have various effect on synaptic transmission properties both on neuronal cell culture and organotypic slices.

Figure 4—figure supplement 1.

(A) Representative images from control and NLG1 and NLG1-ΔCter expressing neurons in culture, with an expanded miniature trace example. (B) Analyses of miniature EPSC, from left to right are represented the amplitude, the frequency, the 20–80% rise time and the decay time constant. (C) Representative images from NLG1 and NLG1-ΔCter expressing neurons in organotypic hippocampal culture. (D) Analyses of asynchronous EPSC, from left to right are represented the amplitude, the frequency, the rise time and the decay time. For all figures, the control is represented in dark, the NLG1-ΔCter in red and the NLG1 in green. Each dot represents the mean value for an individual cell.
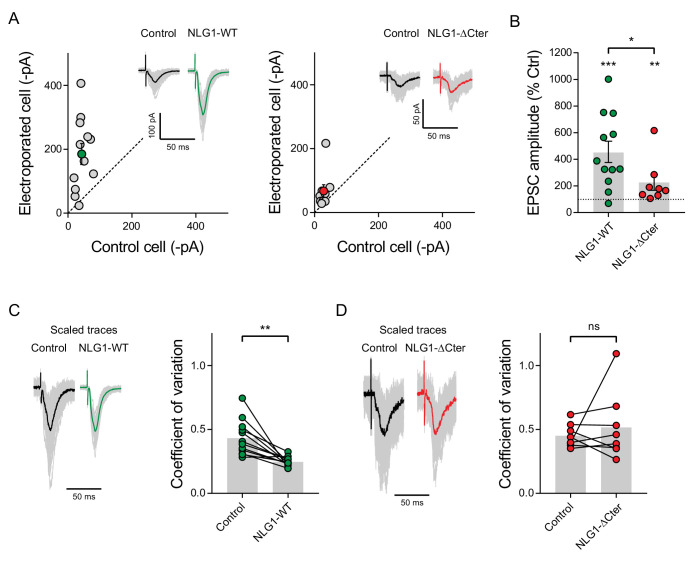
Figure 4—figure supplement 2. EPSC amplitude from NLG1-ΔCter expressing neurons is decreased compared to neurons expressing NLG1.

Figure 4—figure supplement 2.

(A) Comparison of EPSC amplitude on paired neurons in organotypic slices, when NLG1 (left panel), and NLG1-ΔCter (right panel) are expressed, and representative traces. (B) Average of the normalized EPSC amplitude, with 100% representing the control paired cell. (C and D) 100 traces are obtained from control and electroporated cells to extract the coefficient of variation. The left panel represents an example of the various responses recorded from single cells (grey traces) with the average trace in dark (control cell) or color (electroporated cell). The right panel shows the comparison of the coefficient of variation between pairs of neurons, when neurons expressed NLG1 (C), and NLG1-ΔCter (D).
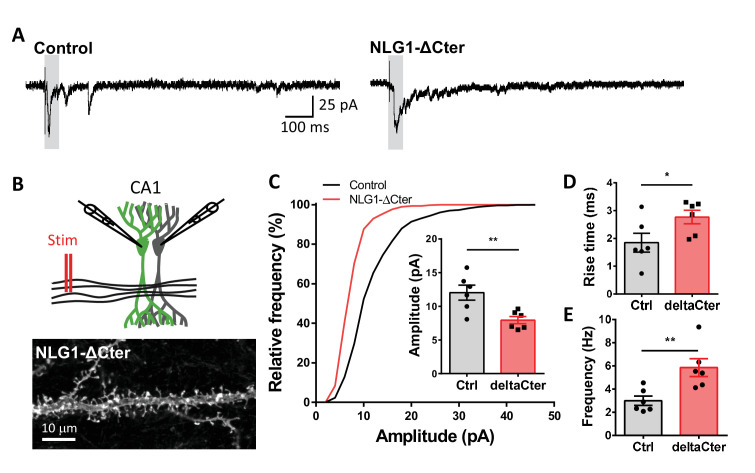
Figure 4—figure supplement 3. aEPSCs are decreased when NLG1-ΔCter is expressed in NLG1 KO background.

Figure 4—figure supplement 3.

(A) Representative traces of asynchronous EPSCs recorded in the presence of strontium, of either a control and a NLG1-ΔCter expressing neuron in a Nlg1 KO background. (B) Scheme of the patch clamp protocol used to record asynchronous EPSC on organotypic hippocampus slices. Two neighboring neurons are simultaneously patched, one transfected and one non transfected, Schaffer collateral connecting both neuron are then stimulated. To avoid multi synaptic responses, 50 ms following the stimulation are excluded from the analysis. Bottom, example of a transfected cell. (C) Cumulative distribution of aEPSCs amplitude recorded from control (dark),or neurons expressing GFP + NLG1-ΔCter (red). Average of aEPSCs amplitude, with connection between the transfected cell and their respective neighboring non transfected control. (D and E) Rise time and frequency of aEPSC of non-transfected cell and when NLG1-ΔCter is expressed (n = 6 pairs of neurons, 20 sweeps per cell).
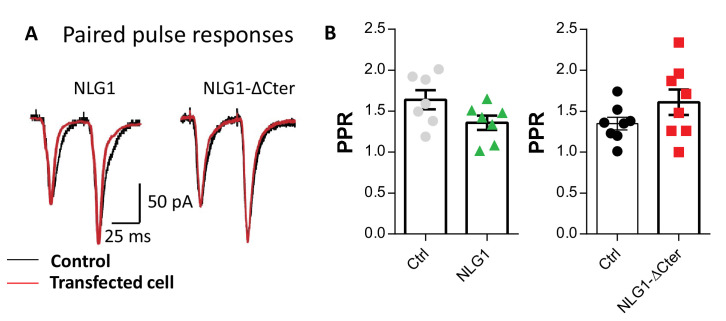
Figure 4—figure supplement 4. Expression of NLG1-ΔCter does not affect paired-pulse ratio.

Figure 4—figure supplement 4.

(A) Example of paired-pulse currents recorded from CA1 neurons in organotypic hippocampal slices, expressing either NLG1 or NLG1-ΔCter (in red) and from their respective untransfected neighbors (in black). (B) Average paired pulse ratio for the same conditions as in (A) (n = 7 and 8 pairs of cells for NLG1 and NLG1-ΔCter, respectively).