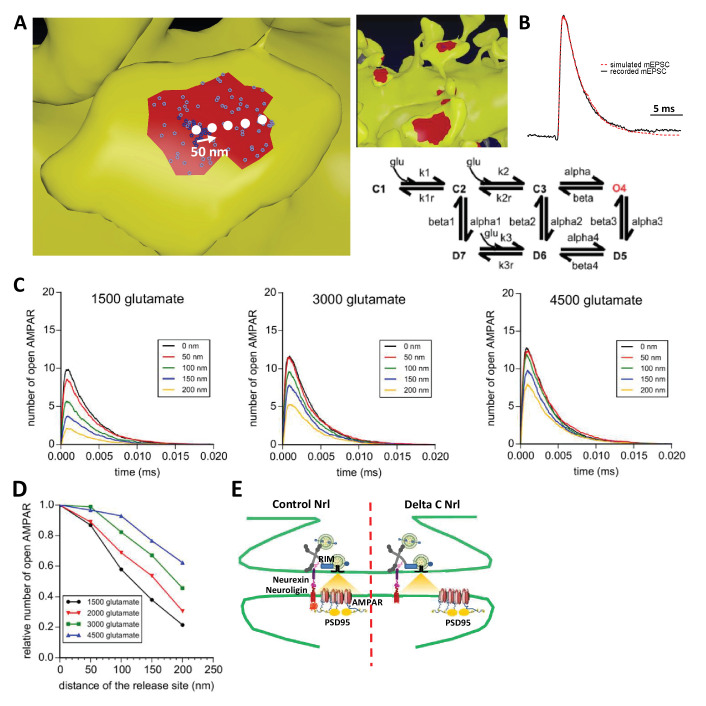
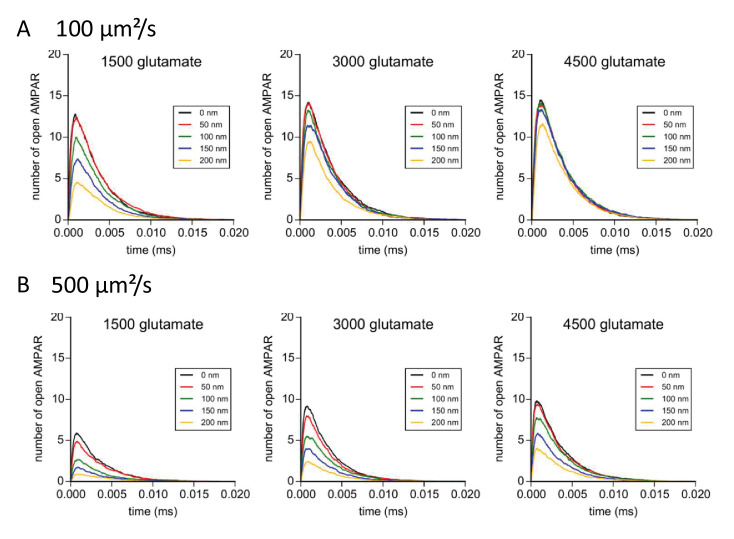
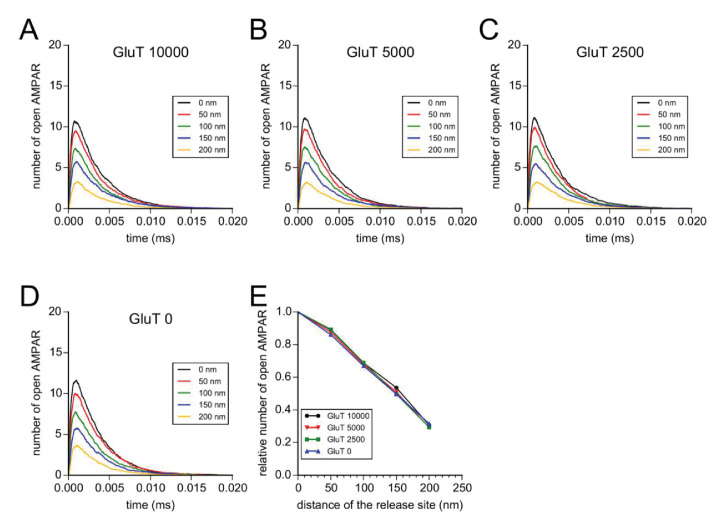
Figure 6. Simulation of AMPAR activation.
(A) View of dendritic spine with synaptic contact area (red patch) containing 25 AMPARs anchored in nanocluster (blue particles) and 70 freely diffusible AMPAR (light blue particles). The simulated glutamate release locations are shown by white dots spaced 50 nm apart. (B) Superposition of a miniature average trace obtained by electrophysiology (dark line) and simulated currents (red line) and,kinetic scheme for activation of AMPAR by glutamate (Jonas et al., 1993). Kinetic rate constants values (after fitting as described in Materials and methods): k1 = 13.77 μM−1.s−1; k1r = 2130 s−1; k2 = 85.2 μM−1.s−1; k2r = 1630 s−1; alpha = 1696 s−1; beta = 630 s−1; alpha1 = 1445 s−1; beta1 = 19.6 s−1; alpha2 = 86 s−1; beta2 = 0.3635 s−1; alpha3 = 8.85 s−1; beta3 = 2 s−1; alpha4 = 6.72 s−1; beta4 = 133.28 s−1; k3 = 3.81 μM−1.s−1; k3r = 22.85 s−1; AMPAR diffusion constant = 0.1 μm2.s−1; and glutamate diffusion constant = 100 μm2.s−1. (C) Time course of simulated AMPAR activation resulting from release of 1500, 3000, and 4500 glutamate molecules at each release location are shown. Each time course is the average of 100 simulations. (D) Normalized peak number of open AMPARs activated by release of 1500, 2000, 3000, and 4500 glutamate molecules at each release location is shown. Dashed line at 90 nm indicates data displayed in E. (E) Percent decrease in peak number of open AMPAR as a function of number of glutamate molecules released, at 90 nm release distance. Dashed lines indicate that when ~2000 glutamate molecules are released the peak number of open AMPARs will be decreased by 25% at a release distance of 90 nm.


