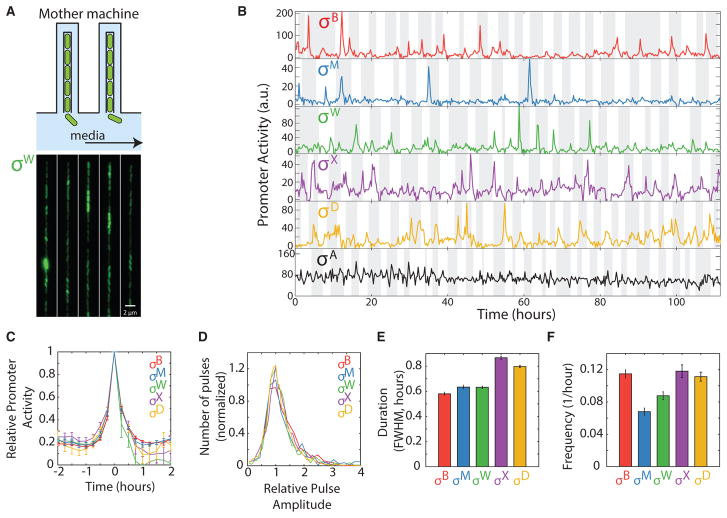
Figure 2. Five Alternative Sigma Factors Exhibit Pulsatile Dynamics over Extended Timescales in the Mother Machine.
(A) The mother machine microfluidic device enables long-term analysis of a single cell maintained at the end of a channel for multiple cell generations (schematic, top, and image of cells in device, bottom).
(B) Analysis of individual cell lineages show pulsatile dynamics of five alternative sigma factors as well as the constitutively active sigma factor σA for over 100 hr. Traces represent rates of fluorescent protein expression from target promoters for each sigma factor (promoter activity). Cell cycles are indicated by alternating gray and white vertical bands. Note that activity values in these conditions are not directly comparable with those in Figure 1E.
(C) Mean pulse dynamics for each alternative sigma factor species. For each sigma factor, n ≥ 320 pulses were detected, aligned around their peaks, and averaged. Error bars are SEM.
(D) Distribution of normalized pulse amplitudes for the indicated sigma factors.
(E) Mean pulse durations, quantified as full-width at half maximum (FWHM) for each of the alternative sigma factors. Error bars are SEM.
(F) Pulse frequencies for the indicated sigma factors. Error bars are SEM.
See also Figure S3.

