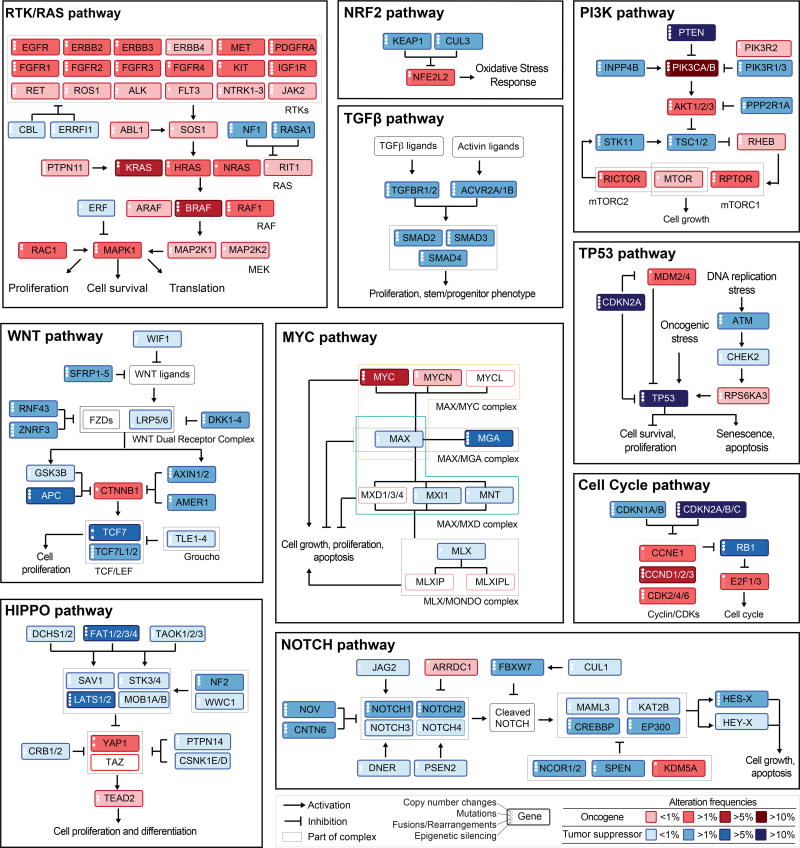
Figure 2. Curated Pathways.
Pathway members and interactions in the ten selected pathways. Genes are altered at different frequencies (color intensity indicates the average frequency of alteration within the entire data set) by oncogenic activations (red) and tumor suppressor inactivations (blue). The types of somatic alteration considered for each gene (copy-number alterations, mutations, fusions or epigenetic silencing) are specified using a set of four vertical dots on the left of each gene symbol. An expanded version including cross-pathways interactions is provided as Figure S1.

