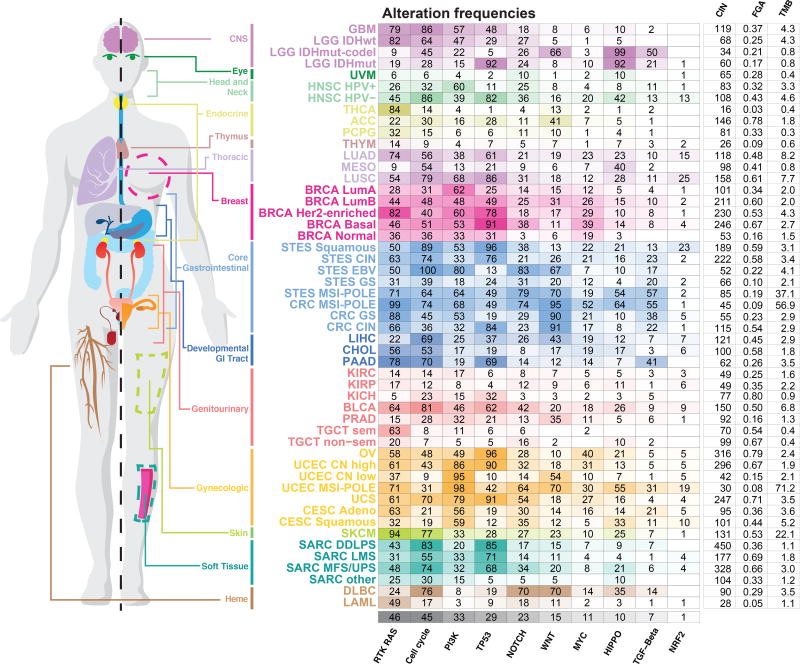
Figure 3. Pathway alteration frequencies.
Fraction of altered samples per pathway and tumor subtype. Pathways are ordered by decreasing median frequency of alterations. Increasing color intensities reflect higher percentages. Average mutation count, as well as number of unbalanced segments and fraction genome altered (two measures of the degree of copy-number alterations) per cancer subtype are also provided. The MSI and POLE subtypes were grouped in this figure in colorectal, stomach and endometrial cancers.

