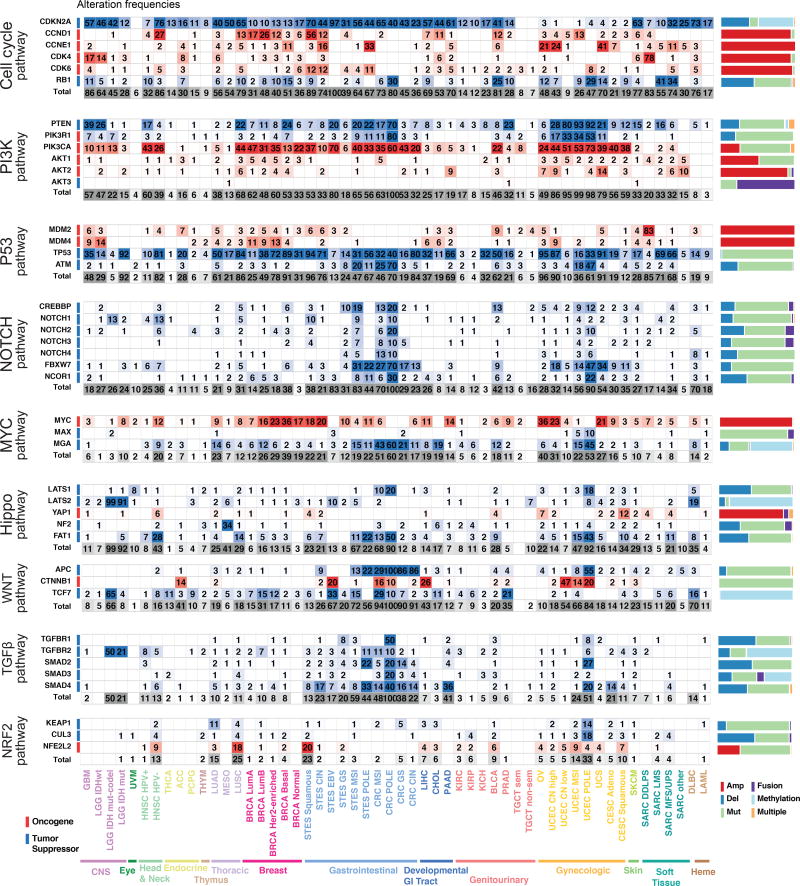
Figure 5. The most commonly altered genes in nine signaling pathways.
Oncogenic alteration frequencies per gene and tumor subtype for the most frequently altered genes in each pathway (for RTK-RAS see Figure 4). Red: activating events; blue: inactivating events; frequency of occurrence scale with color intensity. Last row for each pathway: overall alteration frequency of that pathway per tumor type. The individual gene alteration frequencies may add up to more than the total for each tumor type, as some tumor samples have multiple alterations. Color side bars show the fraction of samples affected by each type of somatic alteration (or a combination of them) for each pathway gene. Comprehensive heat maps with alterations for every gene in each pathway are in Figure S2 and Figure S3.

