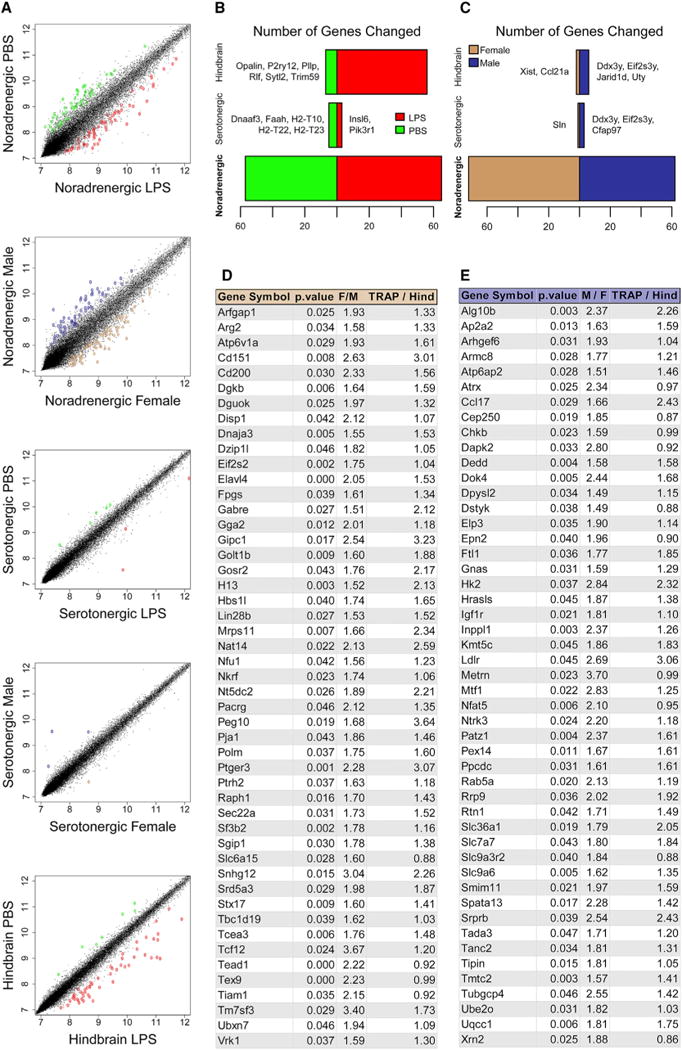
Figure 3. Differentially Expressed Genes by Sex.

(A–C) Scatterplots contrasting transcriptional data between LPS and vehicle (PBS) or sex (A); DEGs are indicated by color. (B and C) Number of DEGs after LPS
(B) (red, up; green, down) or between vehicle-treated sexes (C) in each sample type (see also Tables S1C–S1G).
(D and E) Top 50 named sex-DEGs in LC of females (D) or males (E). M/F or F/M represents fold change between sexes; TRAP/Hind represents fold change, TRAP versus hindbrain.
See also Figure S2 and Tables S1C–S1G.
