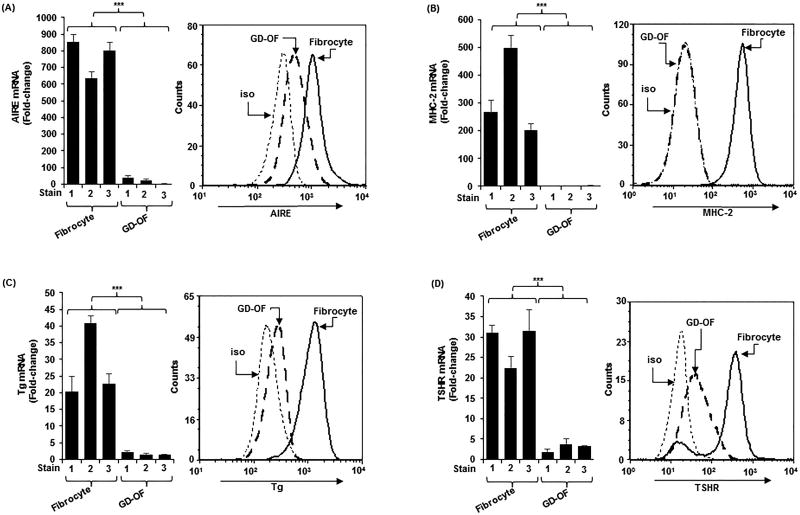
Figure 1.
Higher levels of (A) autoimmune regulator protein (AIRE), (B) MHC Class II (MHC-2) (C) thyroglobulin (Tg), (D) thyrotropin receptor (TSHR) in fibrocytes than orbital fibroblasts from patients with Graves’ disease (GD-OF). Confluent cell layers were harvested and (left panels) RNA isolated, reverse-transcribed, and subjected to real-time PCR and (right panels) stained with the labeled antibodies for flow cytometry as described in the Methods section. mRNA data were normalized to their respective GAPDH levels and are expressed as the mean ± SD of triplicate determinations. MFI data: AIRE, fibrocytes, 813.35 ± 30.18 vs GD-OF, 223.35 ± 31.2 (4-fold); MHC-2, fibrocytes, 490.56 ± 13.35 vs GD-OF, 18.73 ± 17.82 (11,797-fold); Tg, fibrocytes, 965.97 ± 21.85 vs GD-OF, 14.35 ± 15.84 67-fold); TSHR, fibrocytes, 193.58 ± 24.2 vs GD-OF, 26.92 ± 18.82 (7-fold). Data from flow analysis denote fluorescence intensity compared with isotype controls. *** P<0.001. A total of three experiments were performed.

