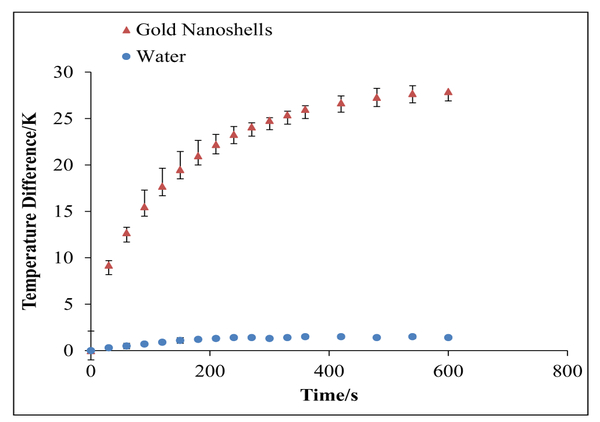
Figure 4.
The temperature difference as a function of time for gold nanoshells in water with exposure to an 808-nm laser diode (200 mW). Data for gold nanoshells in water are represented by triangles, while data for water alone are represented by the circles. The error bars correspond to standard deviations from triplicate measurements. In the case of water, the error bars are smaller than the circle symbols.

