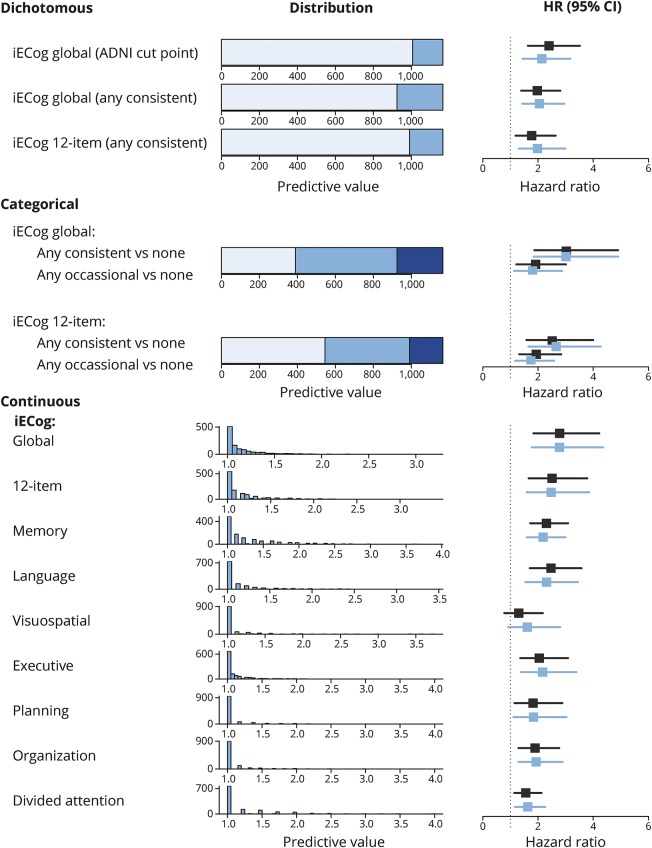
Figure 2. Distribution of informant-based SCD measures and their association with incident mild cognitive impairment.
Distribution and predictive value of different SCD measures. Unadjusted HRs are depicted in black, adjusted HRs in blue. Dichotomous models: light blue indicates a score below the cutpoint and intermediate blue a score above the cutpoint. Categorical models: light blue indicates no SCD, intermediate blue any occasional SCD (but no consistent SCD), and dark blue any consistent SCD. Continuous models: the histograms either depict the number of participants endorsing any number of points on the Blessed questionnaire or any average score on the ECog domains. HRs in these models represent the risk increase associated with a 1-point increase. ADNI = Alzheimer's Disease Neuroimaging Initiative; CI = confidence interval; HR = hazard ratio; iECog = informant-based Everyday Cognition; SCD = subjective cognitive decline.

