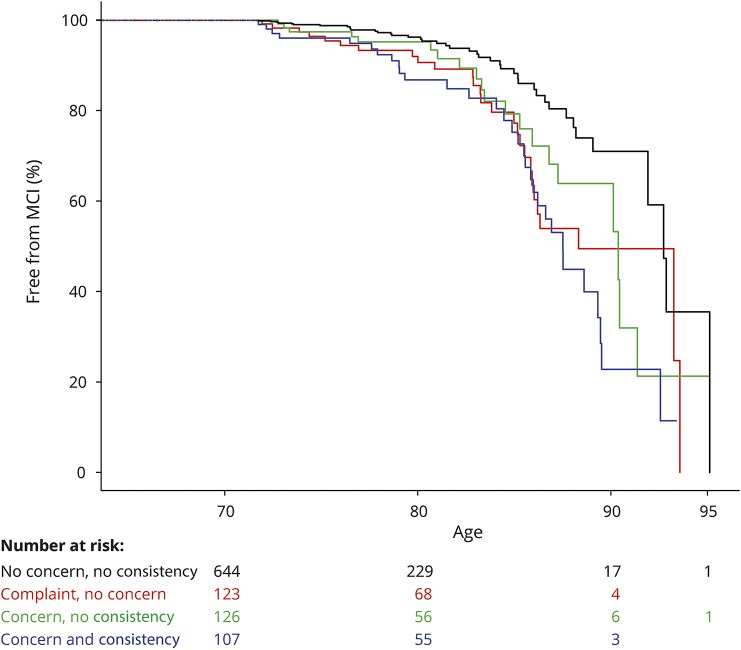
Figure 3. Kaplan-Meier curve combining consistency of complaints on the 12-item ECog and concern.
Figure with separate lines for combined presence of consistent complaints (denoted by consistency) and worry with age as time scale. Below the figure are numbers entering each time interval. Because participants enter and leave the model based on their age at first ECog and subsequent incident MCI or censorship, numbers at 80, 90, and 95 years old are not derivatives of numbers at 70 years old. ECog = Everyday Cognition; MCI = mild cognitive impairment.

