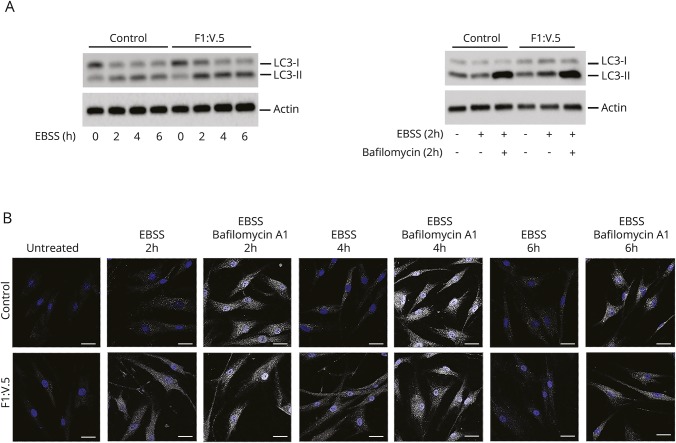
Figure 4. Investigation of the autophagic flux.
(A) Microtubule-associated protein 1A/1B-light chain (3LC3) levels were analyzed in control and patient fibroblasts treated with Earle balanced salt solution (EBSS) for different times. Western blot analysis shows that LC3II accumulates in patients' fibroblasts. After incubation of the cells in EBSS and treatment with 200 nmol/L bafilomycin (2 hours), no significant differences were seen between control and patient cells. (B) Confocal laser scanner microscopy analysis was performed in the same experimental conditions reported in panel A and confirms the same findings. Bars correspond to 40 μm.

