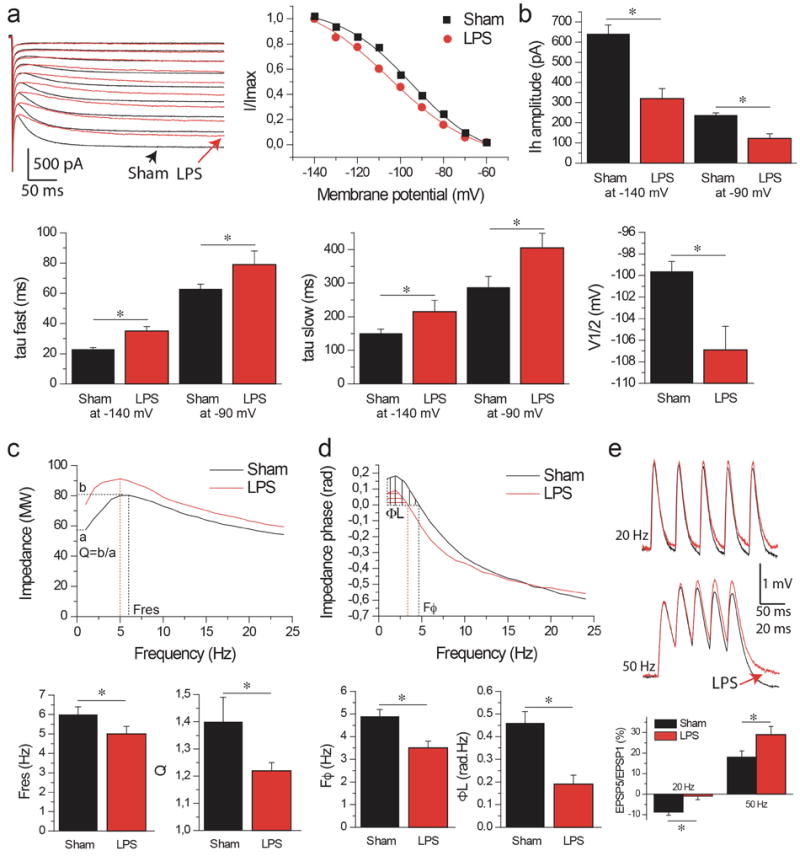
Figure 4. Decreased Ih, theta resonance and phase lead and increased temporal summation after LPS.

Rats were used for electrophysiological analysis 24 h after LPS (n=6) or vehicle injection (Sham, n=8).
(a) Left panel: Ih activation in CA1 pyramidal cell distal dendrites in sham (black) and LPS-treated (red) animals. Right panel: Ih activation curves fitted with a Boltzman function. Note the decrease in amplitude and the shift of the activation curve to more hyperpolarized values in LPS as compared to Sham. (b) Histogram of Ih amplitude, fast and slow time constant (tau) and V1/2 in Sham and LPS animals. All parameter changes will decrease Ih availability in dendrites of LPS animals. (c) Top panel: Impedance magnitude as a function of the input frequency in Sham (black trace) and LPS (red trace) animals. Bottom panels: Summary histograms of resonance frequency, Fres, and amplification ratio, Q. Resonance is decreased in LPS animals. (d) Same as (c) for phase responses. Note that the phase advance due to Ih activation is decreased in LPS animals. (e) Temporal summation of EPSPs at 20 and 50 Hz. Note that the summation is increased in LPS animals. Data are mean±s.e.m. *p<0.05 by Mann–Whitney test.
