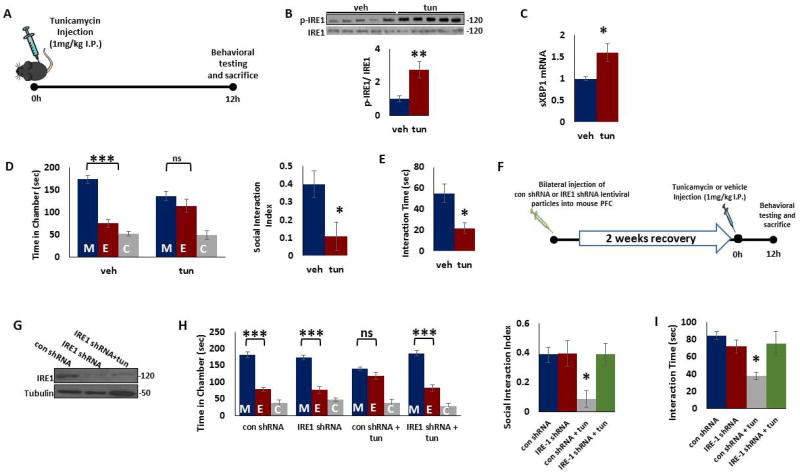
Figure 1. IRE-1 in PFC mediates ER stress-induced deficits in social behavior in male mice.
A) Treatment paradigm. Young adult male mice were injected intraperitoneally with tunicamycin (1mg/kg in dimethyl sulfoxide, DMSO) or vehicle (DMSO). Behavior tests were performed 12 h after tunicamycin injection. B) Tunicamycin treatment induced activation of IRE1. Phospho-IRE1 and IRE1 protein levels were determined in the mouse prefrontal cortex (PFC) 12 h after tunicamycin injection. Top. Representative blot. Bottom. Quantification of phospho-IRE1 to IRE1 ratio. Protein levels were measured by western blot analysis. **p < 0.01; Student's t-test. C) Tunicamycin treatment induced increase in spliced XBP1 (sXBP1) mRNA levels. mRNA levels of sXBP1 were determined by qRT-PCR in the mouse PFC 12 h after tunicamycin injection. The Cycle threshold (Ct) values were normalized to ribosomal protein S3 (RPS3). *p < 0.05; Student's t-test. D–E) Tunicamycin treatment induced deficits in social behavior. D) The three-chamber social interaction test. Left, time in chamber. ***p<0.001 vs. stranger mouse chamber. Two-way ANOVA (n=7 per group). Right, the discrimination index calculated as the difference in the time spent in the social and non-social chambers, divided by the sum of the time spent in both chambers. *p<0.05; Student's t-test (n=7 per group). E) Reciprocal social interaction test. *p<0.05; Student's t-test (n=7 per group). F) Schematic representation of stereotaxic injection of control or IRE1 shRNA lentiviral particles into mouse PFC followed by tunicamycin treatment for 12 h. G) Representative immunoblot data showing decrease in IRE1 expression in the PFC of mice injected with IRE1 shRNA particles in the presence or absence of tunicamycin. Tubulin was used as loading control. H–I) IRE1 shRNA administration attenuated tunicamycin-induced deficits in social behavior. H) The three-chamber social interaction test. Left, time in chamber. ***p<0.001 vs. stranger mouse chamber. Two-way ANOVA (n=6 per group). Right, the discrimination index calculated as the difference in the time spent in the social and non-social chambers, divided by the sum of the time spent in both chambers. *p<0.05 vs. con shRNA group; One-way ANOVA (n=6 per group). I) Reciprocal social interaction test. *p<0.05 vs. con shRNA group; One-way ANOVA (n=6 per group). Data are expressed as mean ±s.e.m. M, chamber housing stranger mouse; E, chamber housing an empty cage; C, center. ns, non-significant.

